SMR Daily Technical Analysis
NuScale Power Corporation
Develops small modular nuclear reactors (SMRs) aimed at scalable, low-carbon nuclear power generation.
SMR Technical Analysis Summary
SMR is technically positioned in a strong long-term downtrend, though it has spent the recent months attempting to build a base within a wide consolidation range. Short-term momentum has turned bearish following a rejection at the 50-day moving average, increasing the probability of a near-term drift lower toward the bottom half of the trading range. Long-term investors should note that until the price can decisively reclaim the 200-day SMA and break the upper bounds of consolidation, the structural bias remains defensive.
Included In Lists
Related Tickers of Interest
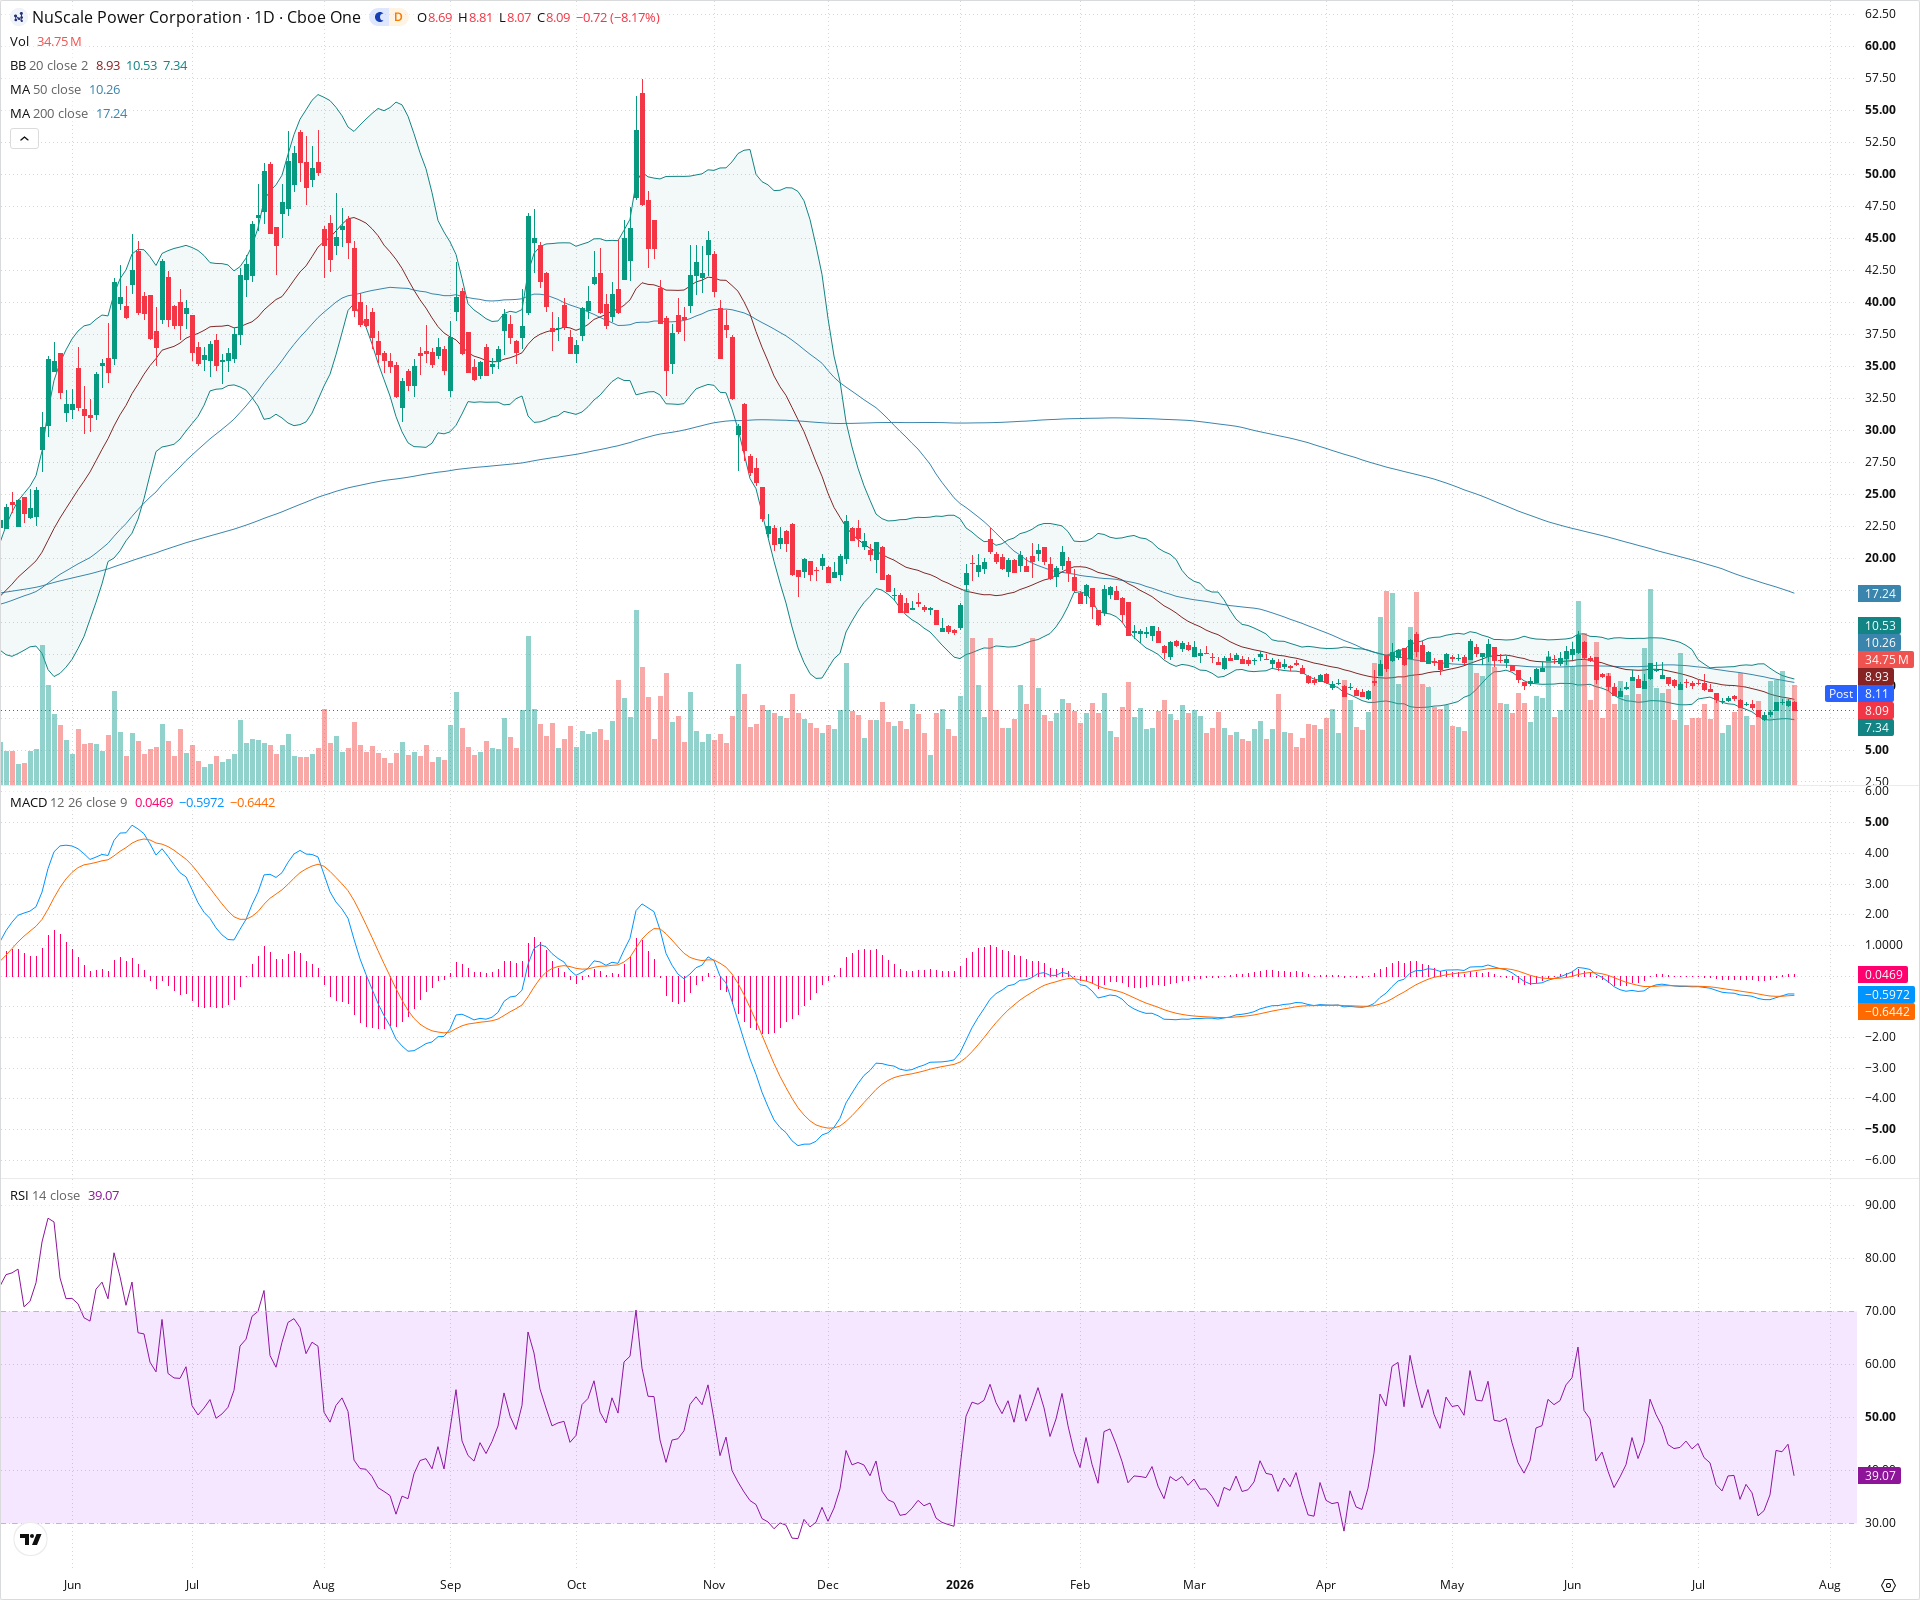
SMR Daily Chart
Sentiment
Short-term Sentiment (days to weeks): Bearish
Price has recently failed at the 50-day SMA resistance and broken back below the 20-day SMA. RSI is declining below the 50 midline, and MACD momentum appears to be stalling after a weak bullish crossover, suggesting sellers are regaining control in the near term.
Long-term Sentiment (weeks to months): Bearish
The overriding long-term trend remains heavily bearish, defined by price trading significantly below a downward-sloping 200-day SMA. The stock is currently trapped in a prolonged, wide consolidation phase following a massive historical decline, with no technical confirmation of a macro trend reversal.
Report Metadata
- Timeframe: daily
- Generated at: 2026-07-24T21:06:24.401Z
- Model: gemini-3.1-pro-preview
Support Price Levels
| Level | Range | Strength | Notes |
|---|---|---|---|
| $7.25 | $7.00 - $7.50 | Weak | Near-term support zone corresponding with recent minor swing lows and the current location of the lower Bollinger Band (~7.34). |
| $5.75 | $5.00 - $6.50 | Strong | Major historical support floor established during the capitulation phase, tested multiple times as the bottom of the current long-term consolidation range. |
Resistance Price Levels
| Level | Range | Strength | Notes |
|---|---|---|---|
| $10.50 | $10.00 - $11.00 | Strong | Immediate significant resistance formed by recent swing highs and the descending 50-day SMA (~10.26). |
| $14.75 | $14.00 - $15.50 | Strong | The established upper boundary of the multi-month macro consolidation range. |
| $17.25 | $17.00 - $17.50 | Strong | Dynamic major resistance provided by the long-term 200-day SMA (~17.24). |
Potential Chart Patterns in Formation
| Strength | Pattern | Signal | Target | Details |
|---|---|---|---|---|
| Strong | Horizontal Consolidation Channel | Neutral | N/A | Following a steep primary downtrend, the price has spent several months oscillating in a wide, roughly horizontal range between significant support near $5.00-$6.00 and resistance near $14.00-$15.00. |
| Weak | Moving Average Rejection | Bearish | $7.34 | The recent price action shows a clear failure to push above the 50-day SMA, resulting in a bearish reversal back below the 20-day SMA. |
Frequently Asked Questions about SMR
What is the current sentiment for SMR?
The short-term sentiment for SMR is currently Bearish because Price has recently failed at the 50-day SMA resistance and broken back below the 20-day SMA. RSI is declining below the 50 midline, and MACD momentum appears to be stalling after a weak bullish crossover, suggesting sellers are regaining control in the near term.. The long-term trend is classified as Bearish.
What are the key support levels for SMR?
StockDips.AI has identified key support levels for SMR at $7.25 and $5.75. These levels may represent potential accumulation zones where buying interest could emerge.
Is SMR in a significant dip or a Value Dip right now?
SMR has a Value Score of 74/100. It is currently flagged as a significant dip in the Top Dips list. It is not listed as a Value Dip because the long-term sentiment or value-score threshold does not qualify.
View the full interactive analysis on StockDips.AI.