CPRT Weekly Technical Analysis
Copart Inc
Online vehicle auction platform connecting insurers, dealers, and buyers.
CPRT Technical Analysis Summary
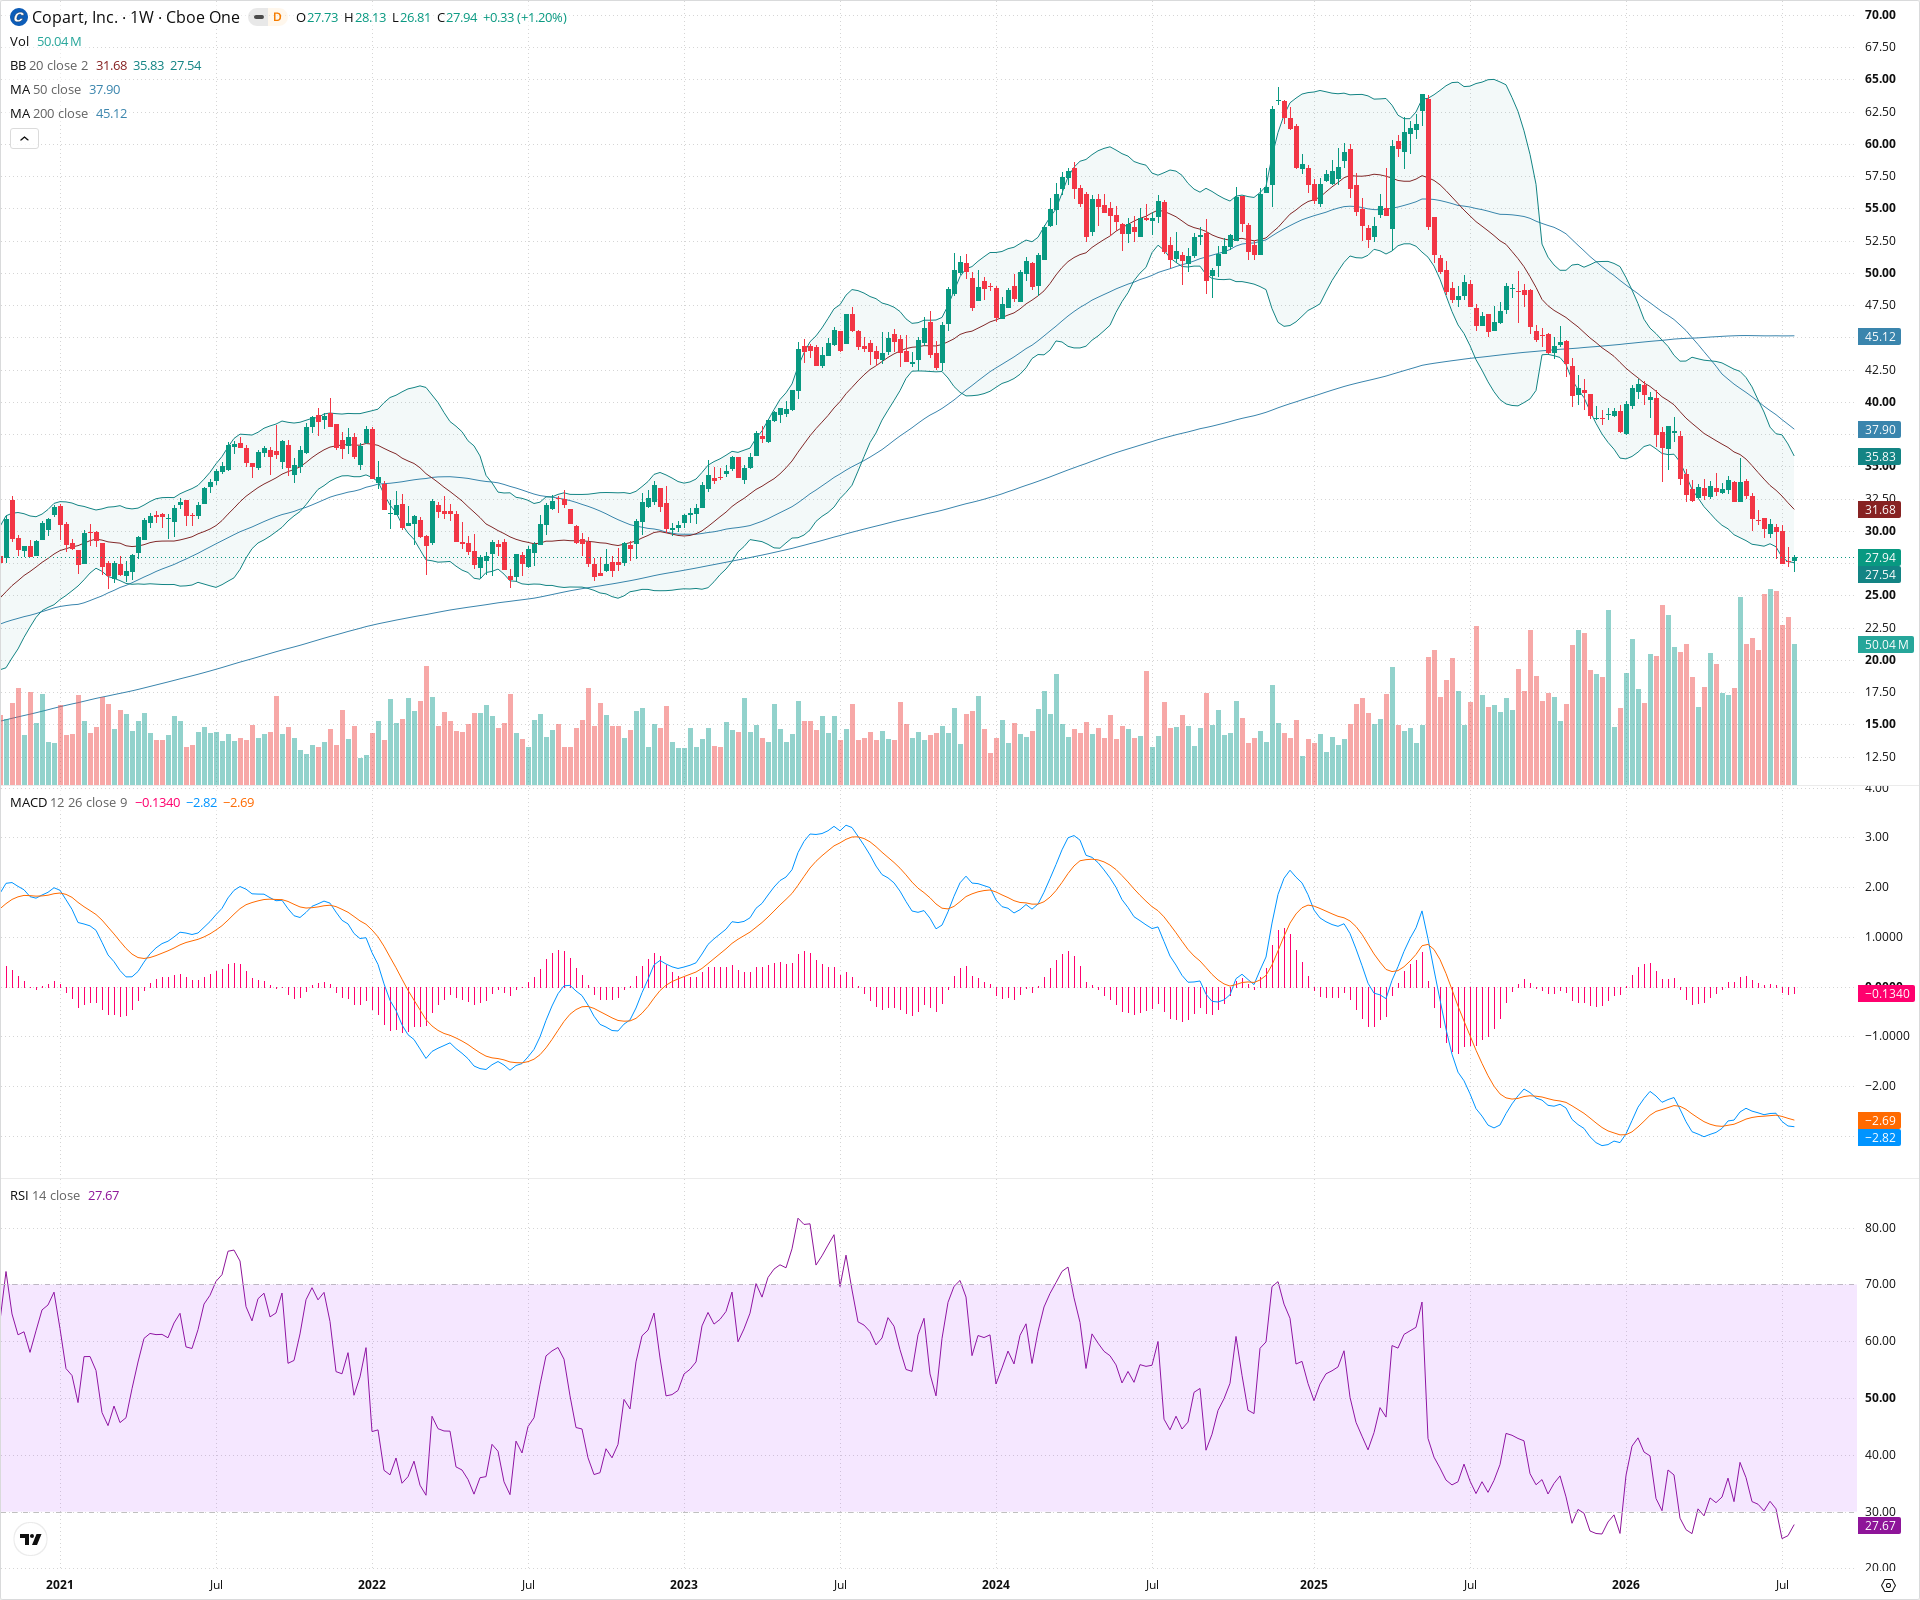
CPRT has undergone a massive structural breakdown, reversing a multi-year uptrend. Price has sliced through the 200-week SMA and is experiencing a severe selloff, confirmed by deeply negative MACD momentum and an impending death cross. While deeply oversold conditions on the weekly RSI suggest a potential bounce or stabilization near the 2022 support zone, the broader technical damage indicates a dominant long-term bear market regime.
Included In Lists
Related Tickers of Interest
CPRT Weekly Chart
Sentiment
Short-term Sentiment (days to weeks): Bearish
Price is in a steep, multi-month downtrend, trading well below all major moving averages and riding the lower Bollinger Band. MACD is deeply negative and expanding.
Long-term Sentiment (weeks to months): Bearish
The long-term uptrend has completely reversed. Price has broken aggressively below the 200-week SMA, and a bearish 'death cross' (50 SMA crossing below 200 SMA) is forming, indicating a major structural shift.
Report Metadata
- Timeframe: weekly
- Generated at: 2026-07-25T09:06:48.449Z
- Model: gemini-3.1-pro-preview
Support Price Levels
| Level | Range | Strength | Notes |
|---|---|---|---|
| $26.00 | $25.00 - $27.00 | Strong | Major structural support zone established during the 2022 lows. Price is currently testing the upper bound of this area. |
Resistance Price Levels
| Level | Range | Strength | Notes |
|---|---|---|---|
| $32.25 | $31.50 - $33.00 | Weak | Initial resistance at previous minor support and the descending 20-week SMA. |
| $37.00 | $36.00 - $38.00 | Strong | Major prior support zone that failed, now acting as heavy resistance, aligning with the falling 50-week SMA. |
| $45.00 | $44.50 - $45.50 | Strong | The 200-week SMA, representing a critical long-term resistance ceiling. |
Potential Chart Patterns in Formation
| Strength | Pattern | Signal | Target | Details |
|---|---|---|---|---|
| Strong | Major Top Breakdown | Bearish | N/A | Price formed a massive distribution top throughout 2024/2025 and broke down violently below the ~$50 support level, initiating the current severe downtrend. |
| Strong | Death Cross | Bearish | N/A | The 50-week SMA is actively crossing below the 200-week SMA, confirming the transition into a long-term bear market. |
Frequently Asked Questions about CPRT
What is the current sentiment for CPRT?
The short-term sentiment for CPRT is currently Bearish because Price is in a steep, multi-month downtrend, trading well below all major moving averages and riding the lower Bollinger Band. MACD is deeply negative and expanding.. The long-term trend is classified as Bearish.
What are the key support levels for CPRT?
StockDips.AI has identified key support levels for CPRT at $26.00. These levels may represent potential accumulation zones where buying interest could emerge.
Is CPRT in a significant dip or a Value Dip right now?
CPRT has a Value Score of 16/100. It is not currently flagged as a significant dip in the Top Dips list. It is not listed as a Value Dip because the long-term sentiment or value-score threshold does not qualify.
View the full interactive analysis on StockDips.AI.