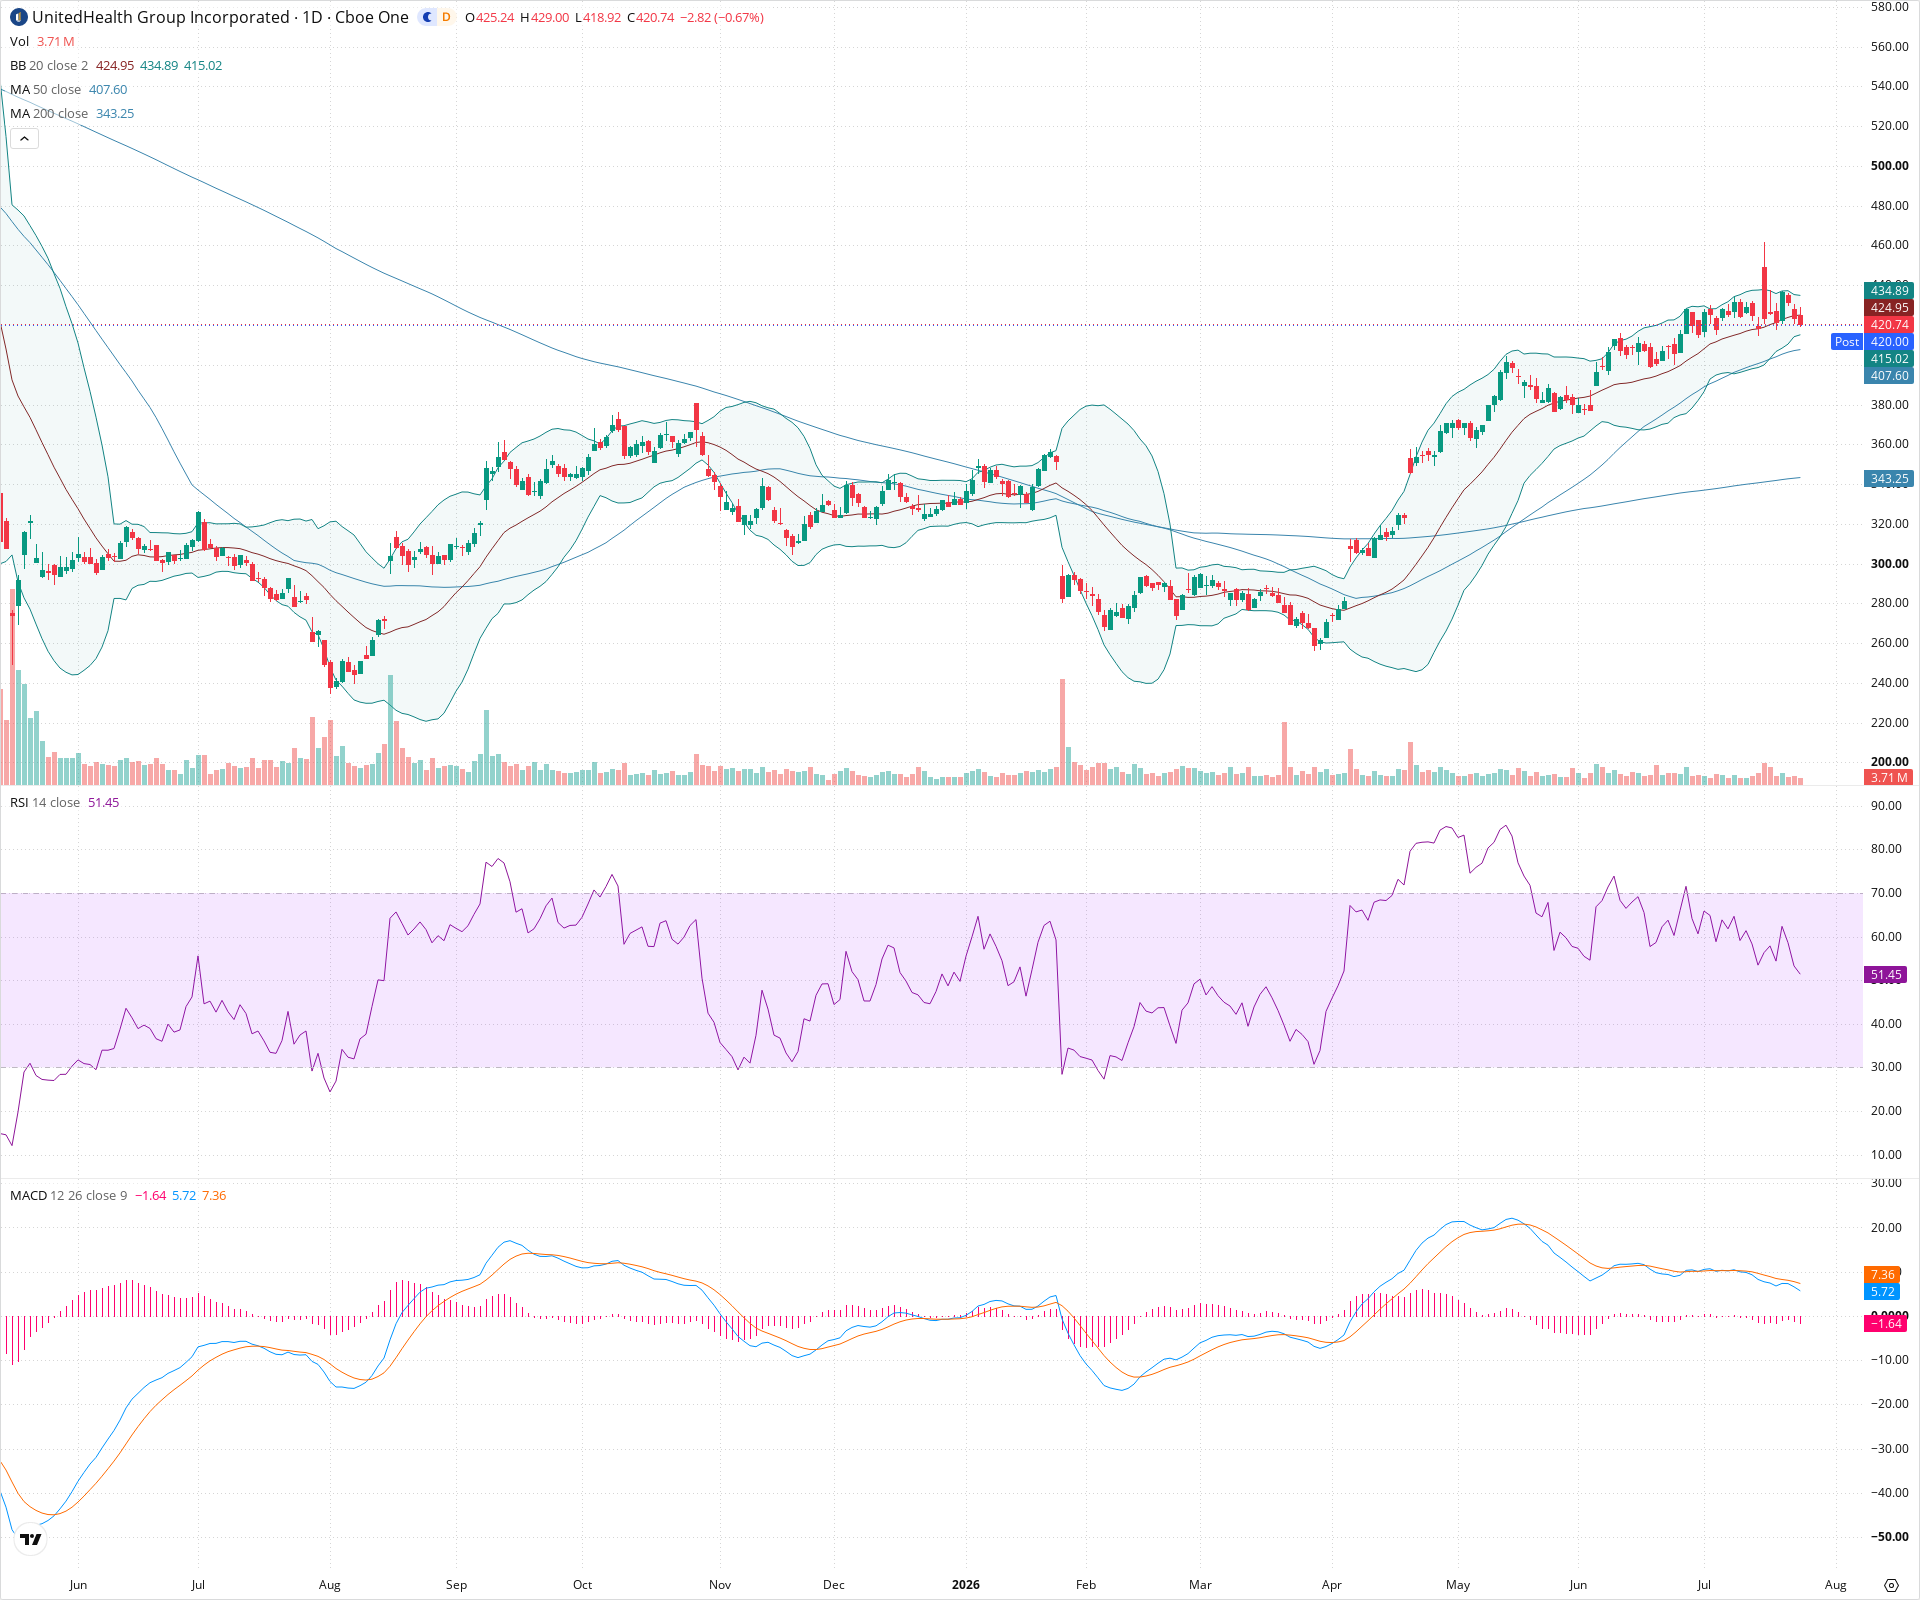
UNH Daily Technical Analysis
UnitedHealth Group Inc
Health insurance and services company operating UnitedHealthcare and Optum divisions.
UNH Technical Analysis Summary
UNH remains in a robust, long-term technical uptrend, supported by upward-sloping key moving averages (50 and 200 SMA). Currently, the stock is navigating a healthy short-term consolidation or pullback phase after reaching overbought conditions at recent highs. While near-term momentum indicators like MACD suggest this cooling-off period may persist a bit longer, the broader structure remains bullish as long as major support zones, particularly around the 50-day SMA, are defended.
Included In Lists
Related Tickers of Interest
UNH Daily Chart
Sentiment
Short-term Sentiment (days to weeks): Neutral
Price is currently experiencing a pullback from recent highs near 440. RSI has cooled off to the mid-line (51.45), and the MACD has registered a bearish crossover with a negative histogram, indicating waning short-term upward momentum as the stock consolidates.
Long-term Sentiment (weeks to months): Bullish
The stock remains in a clear long-term uptrend, characterized by a sequence of higher highs and higher lows since April. The price is trading comfortably above both the 50-day and 200-day SMAs, which are both sloping upwards.
Report Metadata
- Timeframe: daily
- Generated at: 2026-07-24T21:19:24.197Z
- Model: gemini-3.1-pro-preview
Support Price Levels
| Level | Range | Strength | Notes |
|---|---|---|---|
| $407.50 | $405.00 - $410.00 | Strong | This zone aligns with the rising 50-day SMA (407.60) and areas of prior consolidation in late May, making it a logical first area of strong technical support during a pullback. |
| $375.00 | $370.00 - $380.00 | Strong | A major structural support zone established by the swing lows in April and May, just prior to a significant gap up in price. |
Resistance Price Levels
| Level | Range | Strength | Notes |
|---|---|---|---|
| $438.50 | $435.00 - $442.00 | Strong | The immediate overhead resistance zone formed by the recent swing highs and rejection at the upper Bollinger Band. |
Potential Chart Patterns in Formation
| Strength | Pattern | Signal | Target | Details |
|---|---|---|---|---|
| Weak | Bull Flag (Forming) | Bullish | N/A | Following a steep impulsive rally (flagpole) from spring into early summer, the price is currently in a choppy, slightly downward-drifting consolidation phase. This often resolves as a continuation of the prior uptrend if support holds. |
Frequently Asked Questions about UNH
What is the current sentiment for UNH?
The short-term sentiment for UNH is currently Neutral because Price is currently experiencing a pullback from recent highs near 440. RSI has cooled off to the mid-line (51.45), and the MACD has registered a bearish crossover with a negative histogram, indicating waning short-term upward momentum as the stock consolidates.. The long-term trend is classified as Bullish.
What are the key support levels for UNH?
StockDips.AI has identified key support levels for UNH at $407.50 and $375.00. These levels may represent potential accumulation zones where buying interest could emerge.
Is UNH in a significant dip or a Value Dip right now?
UNH has a Value Score of 58/100. It is not currently flagged as a significant dip in the Top Dips list. It is not listed as a Value Dip because the long-term sentiment or value-score threshold does not qualify.
View the full interactive analysis on StockDips.AI.