AMC Daily Technical Analysis
AMC Entertainment Holdings, Inc.
Largest U.S. movie-theater chain, widely known as a high-volatility meme stock with strong retail trader attention.
AMC Technical Analysis Summary
AMC has undergone a structural trend reversal, transitioning from a prolonged downtrend into an emerging uptrend confirmed by a Golden Cross. The stock is currently in a healthy consolidation phase, holding firmly above a thick layer of moving average support (20, 50, and 200-day SMAs). As long as price maintains above the 1.80-1.95 support cluster, the long-term outlook remains constructive, with a breakout above 2.80 needed to trigger the next major leg up.
Included In Lists
Related Tickers of Interest
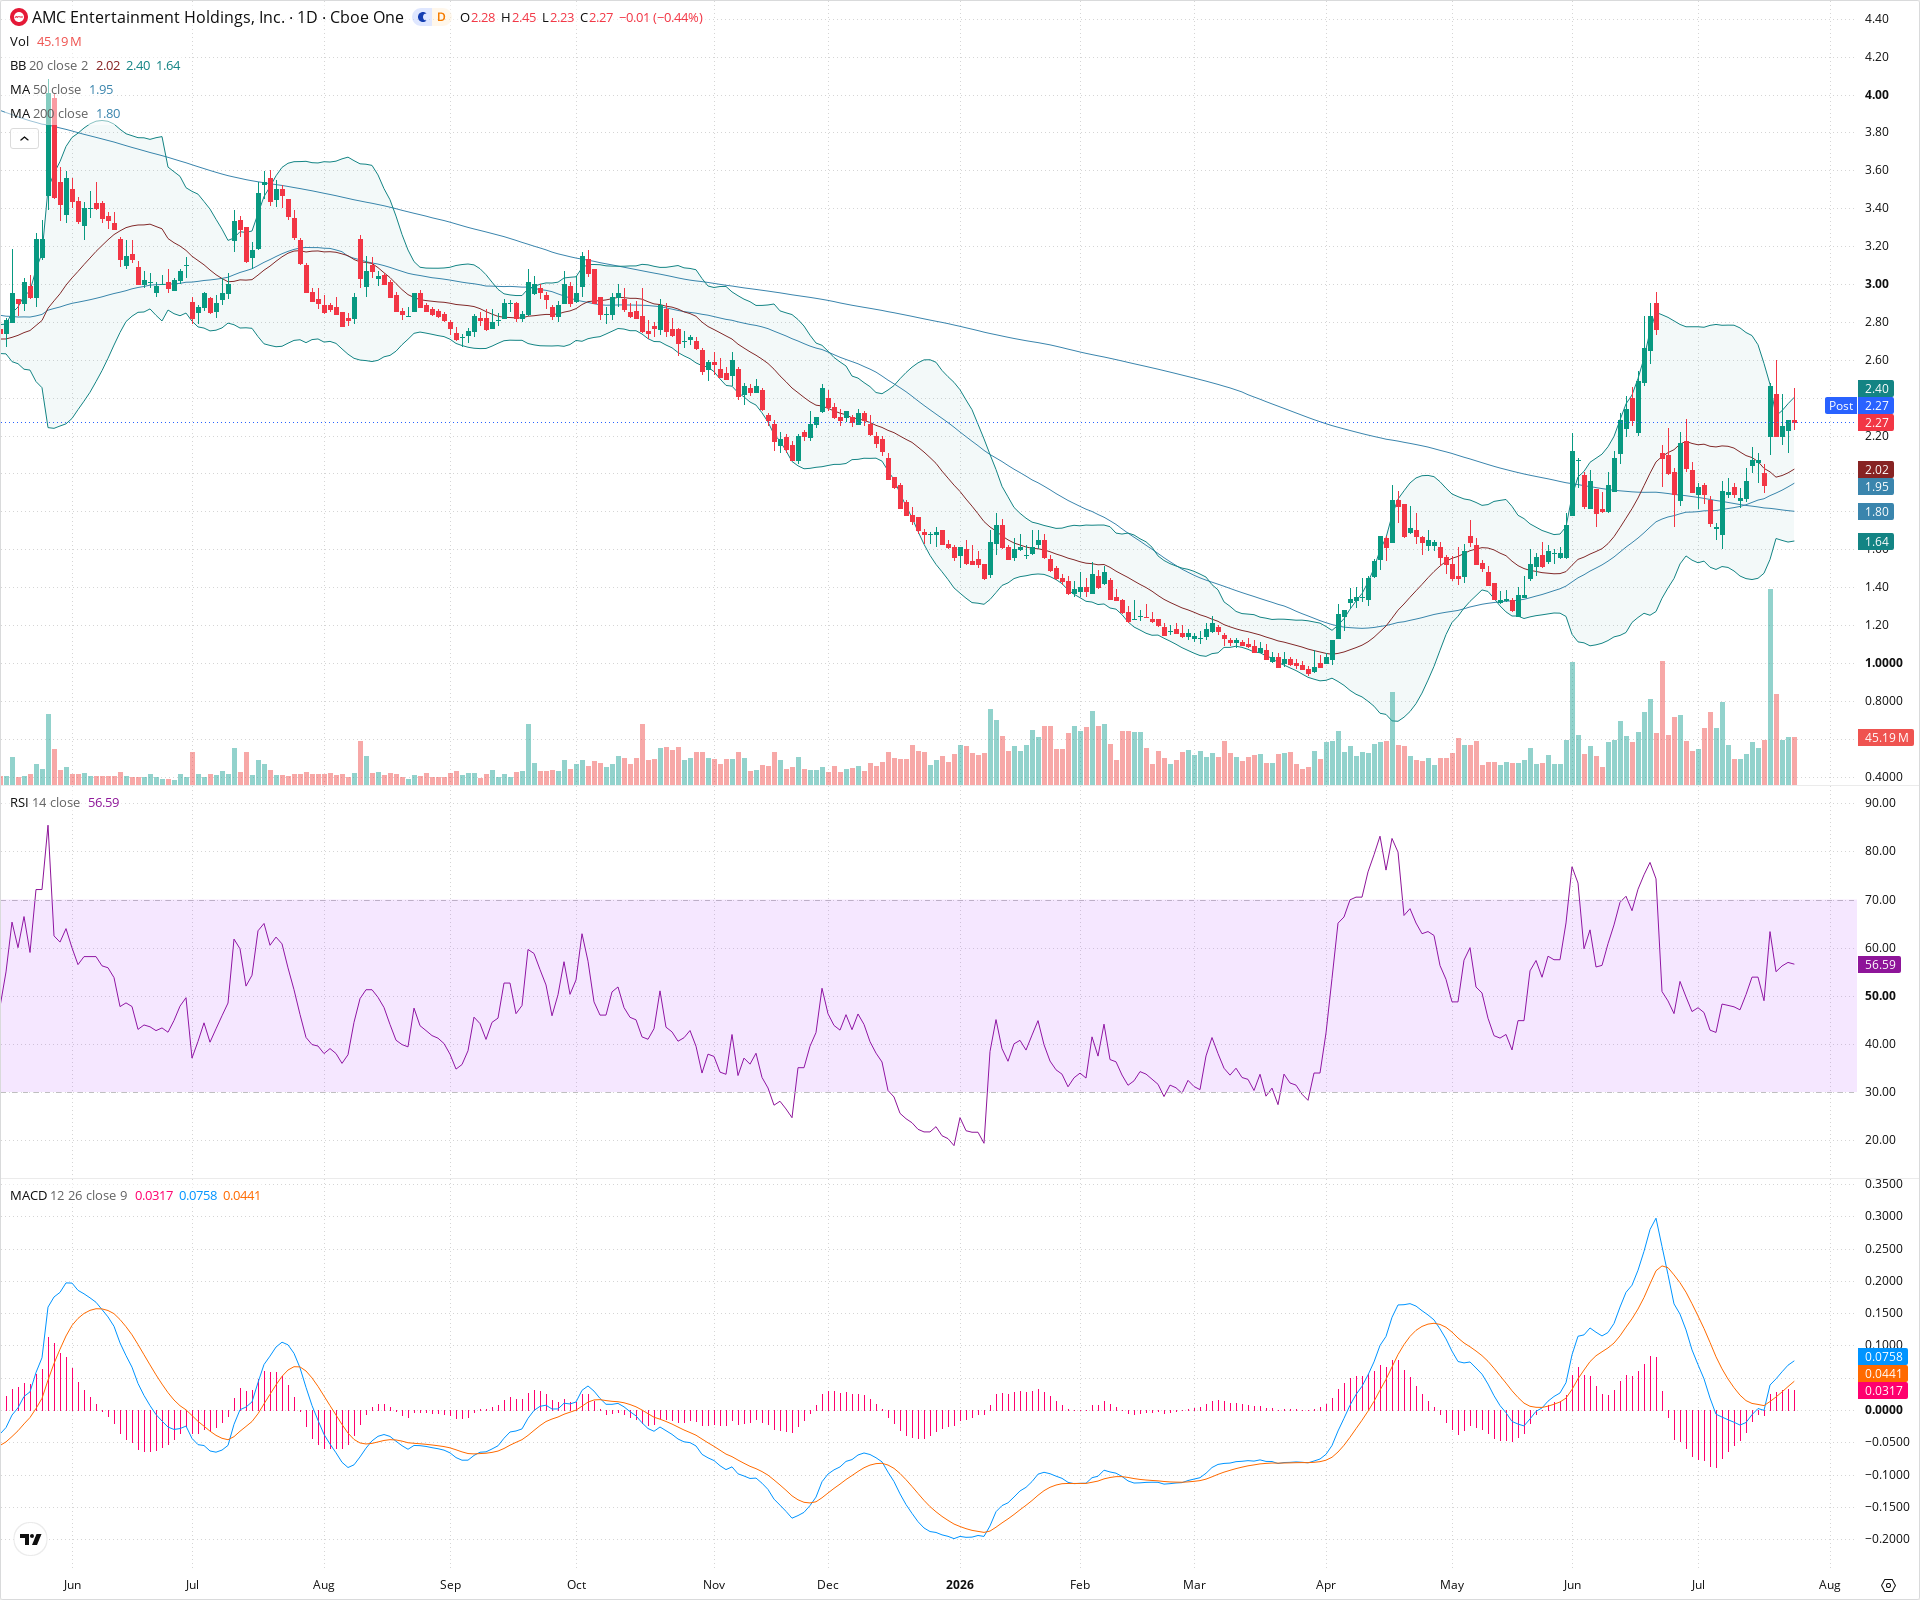
AMC Daily Chart
Sentiment
Short-term Sentiment (days to weeks): Bullish
Price is consolidating above the 20-day SMA, forming higher lows. RSI remains constructive above 50, although the shrinking MACD histogram indicates slightly waning near-term momentum.
Long-term Sentiment (weeks to months): Bullish
The chart exhibits a significant trend reversal, highlighted by a large rounding bottom base and a recent Golden Cross where the 50-day SMA has crossed above the 200-day SMA.
Report Metadata
- Timeframe: daily
- Generated at: 2026-07-24T21:05:31.100Z
- Model: gemini-3.1-pro-preview
Support Price Levels
| Level | Range | Strength | Notes |
|---|---|---|---|
| $2.00 | $1.95 - $2.05 | Strong | Convergence of the 20-day SMA (2.02) and 50-day SMA (1.95), acting as strong dynamic support. |
| $1.78 | $1.70 - $1.85 | Strong | Major support zone reinforced by the 200-day SMA (1.80) and recent swing lows. |
Resistance Price Levels
| Level | Range | Strength | Notes |
|---|---|---|---|
| $2.45 | $2.40 - $2.50 | Weak | Immediate resistance at the upper Bollinger Band (2.40) and recent local highs. |
| $2.85 | $2.80 - $2.90 | Strong | Recent major swing high that rejected previous bullish momentum. |
| $3.45 | $3.40 - $3.50 | Strong | Historical consolidation zone from earlier in the downtrend. |
Potential Chart Patterns in Formation
| Strength | Pattern | Signal | Target | Details |
|---|---|---|---|---|
| Strong | Golden Cross | Bullish | N/A | The 50-day SMA has crossed above the 200-day SMA, signaling a potential long-term trend shift from bearish to bullish. |
| Strong | Rounding Bottom | Bullish | N/A | A prolonged U-shaped recovery visible over several months, indicating a gradual shift in market sentiment from accumulation to markup. |
Frequently Asked Questions about AMC
What is the current sentiment for AMC?
The short-term sentiment for AMC is currently Bullish because Price is consolidating above the 20-day SMA, forming higher lows. RSI remains constructive above 50, although the shrinking MACD histogram indicates slightly waning near-term momentum.. The long-term trend is classified as Bullish.
What are the key support levels for AMC?
StockDips.AI has identified key support levels for AMC at $2.00 and $1.78. These levels may represent potential accumulation zones where buying interest could emerge.
Is AMC in a significant dip or a Value Dip right now?
AMC has a Value Score of 40/100. It is not currently flagged as a significant dip in the Top Dips list. It is not listed as a Value Dip because the long-term sentiment or value-score threshold does not qualify.
View the full interactive analysis on StockDips.AI.