GOOGL Weekly Technical Analysis
Alphabet Inc
Parent of Google leading in search, advertising, YouTube, and cloud computing.
GOOGL Technical Analysis Summary
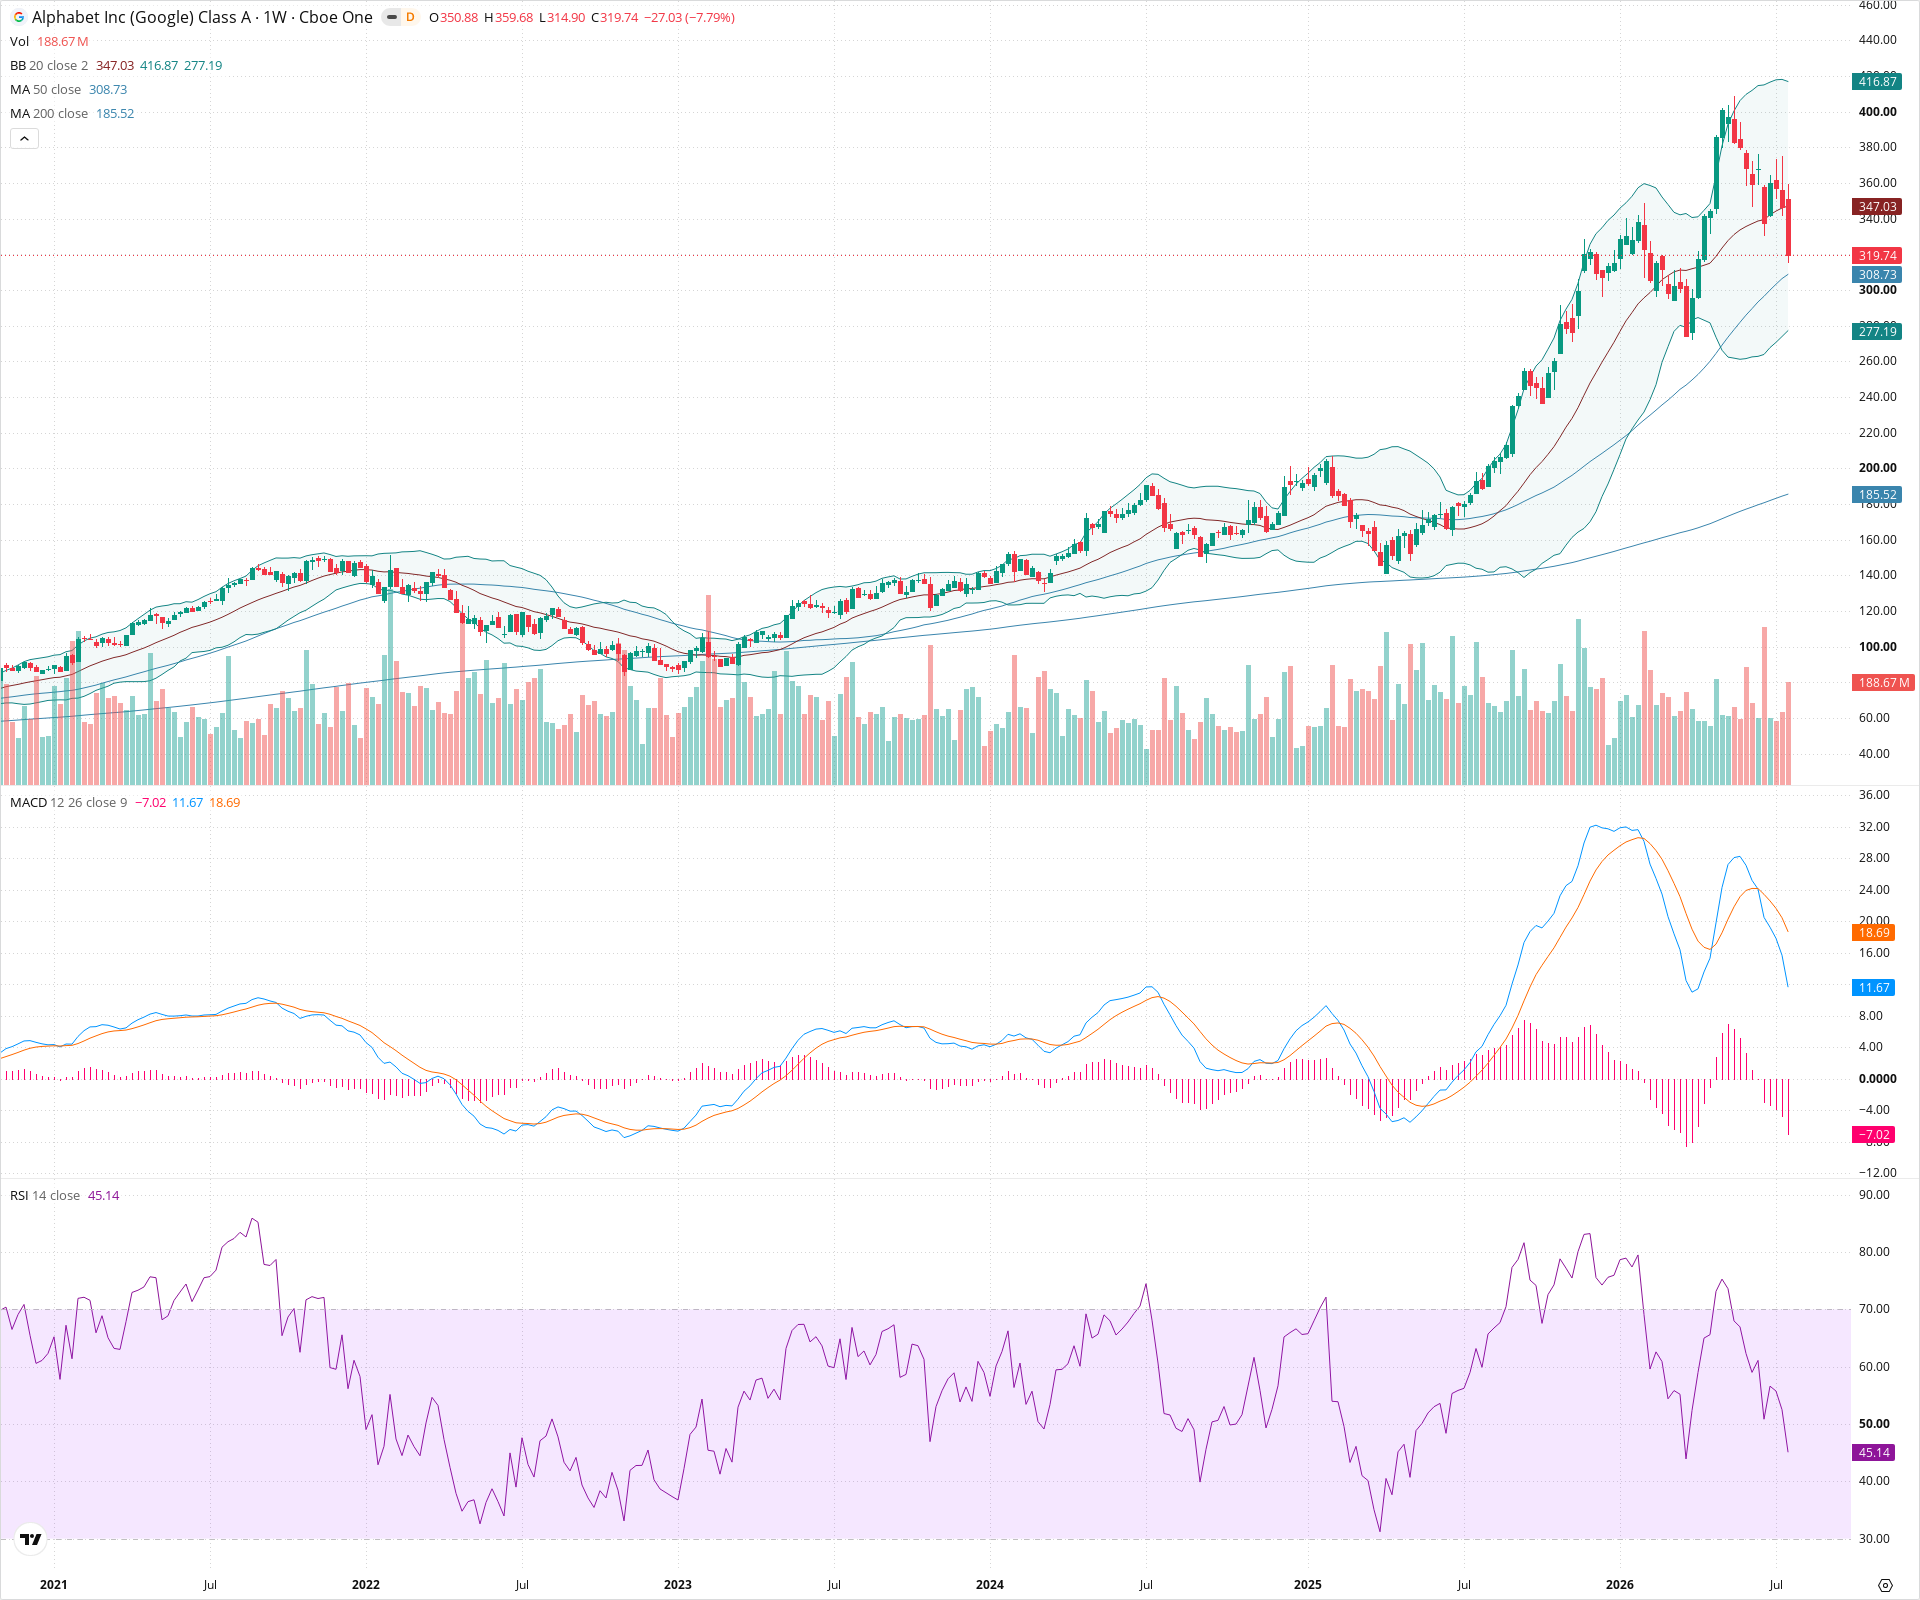
GOOGL is currently undergoing a severe short-term correction, marked by large red weekly candles, a break below the 20-week SMA, and bearish shifts in both MACD and RSI momentum. Despite this immediate weakness, the long-term technical picture remains bullish, supported by rising 50-week and 200-week SMAs. The critical area to watch next is the 300-315 zone, where the 50-week SMA could potentially provide support and establish a higher low to resume the broader uptrend.
Included In Lists
Related Tickers of Interest
GOOGL Weekly Chart
Sentiment
Short-term Sentiment (days to weeks): Bearish
Price has sharply broken below the 20-week SMA on increasing volume. Momentum has shifted to the downside with a bearish MACD crossover, negative histogram, and RSI dropping below the neutral 50 level.
Long-term Sentiment (weeks to months): Bullish
The broader trend remains intact as the price is well above the rising 200-week SMA. The 50-week SMA is also rising steadily, suggesting this is a correction within a larger bull market structure.
Report Metadata
- Timeframe: weekly
- Generated at: 2026-07-25T09:01:45.098Z
- Model: gemini-3.1-pro-preview
Support Price Levels
| Level | Range | Strength | Notes |
|---|---|---|---|
| $307.50 | $300.00 - $315.00 | Strong | Confluence of the rising 50-week SMA (currently ~308.73) and prior consolidation area from late 2025/early 2026. |
| $270.00 | $260.00 - $280.00 | Strong | Major prior resistance zone turned support, established during the choppy uptrend in 2024 and 2025. |
Resistance Price Levels
| Level | Range | Strength | Notes |
|---|---|---|---|
| $350.00 | $345.00 - $355.00 | Strong | The recently broken 20-week SMA (currently ~347.03) which will likely act as dynamic resistance on any relief bounce. |
| $425.00 | $415.00 - $435.00 | Strong | The recent all-time high zone marking the peak of the preceding parabolic move. |
Potential Chart Patterns in Formation
| Strength | Pattern | Signal | Target | Details |
|---|---|---|---|---|
| Strong | Mean Reversion / Sharp Correction | Bearish | $308.00 | After a steep, almost parabolic rise exceeding the upper Bollinger Band, the price is aggressively reverting towards longer-term mean levels (50-week SMA). |
Frequently Asked Questions about GOOGL
What is the current sentiment for GOOGL?
The short-term sentiment for GOOGL is currently Bearish because Price has sharply broken below the 20-week SMA on increasing volume. Momentum has shifted to the downside with a bearish MACD crossover, negative histogram, and RSI dropping below the neutral 50 level.. The long-term trend is classified as Bullish.
What are the key support levels for GOOGL?
StockDips.AI has identified key support levels for GOOGL at $307.50 and $270.00. These levels may represent potential accumulation zones where buying interest could emerge.
Is GOOGL in a significant dip or a Value Dip right now?
GOOGL has a Value Score of 101/100. It is not currently flagged as a significant dip in the Top Dips list. It is not listed as a Value Dip because the long-term sentiment or value-score threshold does not qualify.
View the full interactive analysis on StockDips.AI.