GOOGL Monthly Technical Analysis
Alphabet Inc
Parent of Google leading in search, advertising, YouTube, and cloud computing.
GOOGL Technical Analysis Summary
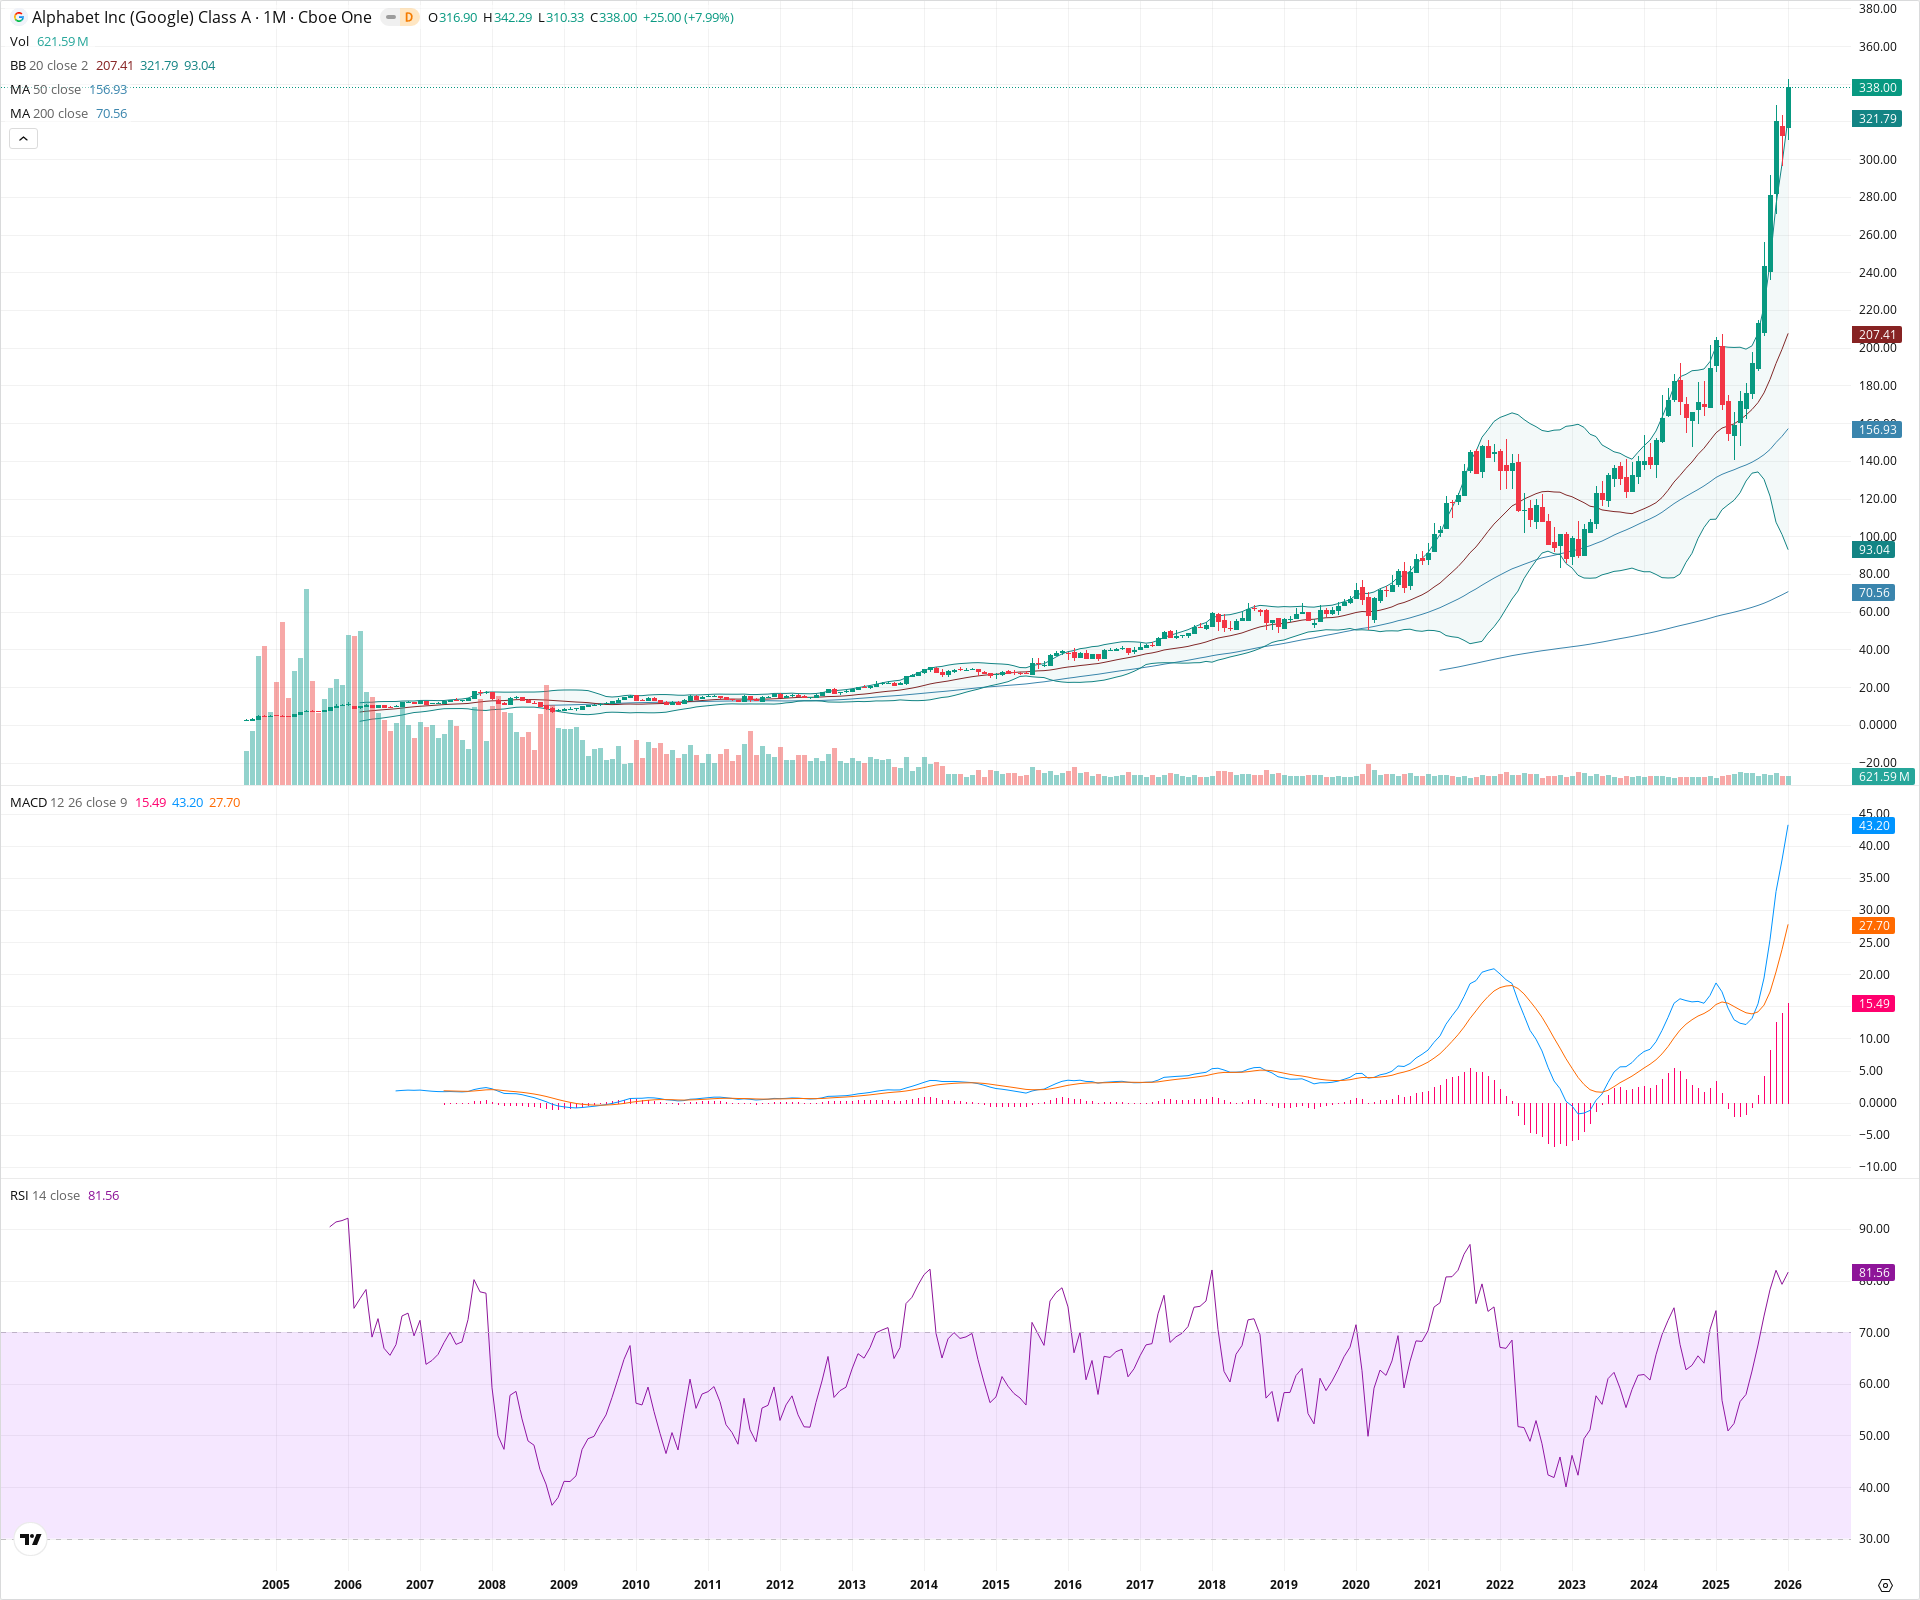
GOOGL is in an extremely strong secular bull market, having cleared previous multi-year highs to enter a parabolic price discovery phase. Momentum indicators like MACD and RSI confirm the strength of the move, though the RSI above 80 and price extension far beyond the upper Bollinger Band suggest a stretched condition typical of a blow-off top or climax run. Investors should regard the trend as intact but exercise caution due to the vertical nature of the recent advance relative to long-term averages.
Included In Lists
Related Tickers of Interest
GOOGL Monthly Chart
Sentiment
Short-term Sentiment (days to weeks): Bullish
Price is in a vertical parabolic advance, closing significantly above the upper Bollinger Band with the MACD histogram expanding. RSI is overbought (81.56) but confirms extreme momentum.
Long-term Sentiment (weeks to months): Bullish
Strong secular uptrend confirmed by rising 50 and 200 SMAs. The stock has successfully broken out of a multi-year consolidation structure above 150.
Report Metadata
- Timeframe: monthly
- Generated at: 2026-02-02T06:23:24.910Z
- Model: gemini-3-pro-preview
Support Price Levels
| Level | Range | Strength | Notes |
|---|---|---|---|
| $204.00 | $200.00 - $208.00 | Weak | Previous consolidation zone before the recent parabolic spike; aligns near the 20-month SMA (207.41). |
| $153.50 | $150.00 - $157.00 | Strong | Former major secular resistance (2021 highs) turned support, coinciding with the 50-month SMA (156.93). |
| $92.50 | $85.00 - $100.00 | Strong | Major cyclical low established during the 2022-2023 correction. |
Resistance Price Levels
| Level | Range | Strength | Notes |
|---|---|---|---|
| $342.15 | $342.00 - $342.29 | Weak | Current all-time high and immediate price ceiling. |
Potential Chart Patterns in Formation
| Strength | Pattern | Signal | Target | Details |
|---|---|---|---|---|
| Strong | Secular Breakout / Parabolic Run | Bullish | N/A | After breaking a multi-year base around 150, the price has entered a parabolic discovery phase, accelerating vertically away from moving averages. |
Frequently Asked Questions about GOOGL
What is the current sentiment for GOOGL?
The short-term sentiment for GOOGL is currently Bullish because Price is in a vertical parabolic advance, closing significantly above the upper Bollinger Band with the MACD histogram expanding. RSI is overbought (81.56) but confirms extreme momentum.. The long-term trend is classified as Bullish.
What are the key support levels for GOOGL?
StockDips.AI has identified key support levels for GOOGL at $204.00 and $153.50. These levels may represent potential accumulation zones where buying interest could emerge.
Is GOOGL in a significant dip or a Value Dip right now?
GOOGL has a Value Score of 101/100. It is not currently flagged as a significant dip in the Top Dips list. It is not listed as a Value Dip because the long-term sentiment or value-score threshold does not qualify.
View the full interactive analysis on StockDips.AI.