GRAB Weekly Technical Analysis
Grab Holdings Ltd
Southeast Asian super app offering ride-hailing, food delivery, and financial services.
GRAB Technical Analysis Summary
The weekly chart for GRAB remains primarily bearish over both short and long-term horizons. After a massive initial sell-off, the stock has spent years in a broad consolidation range. Currently, price action is weak, trading below key moving averages with negative momentum indicators (RSI heading down, MACD negative). A break below the 3.00 support level could see a retest of the absolute lows near 2.50.
Included In Lists
Related Tickers of Interest
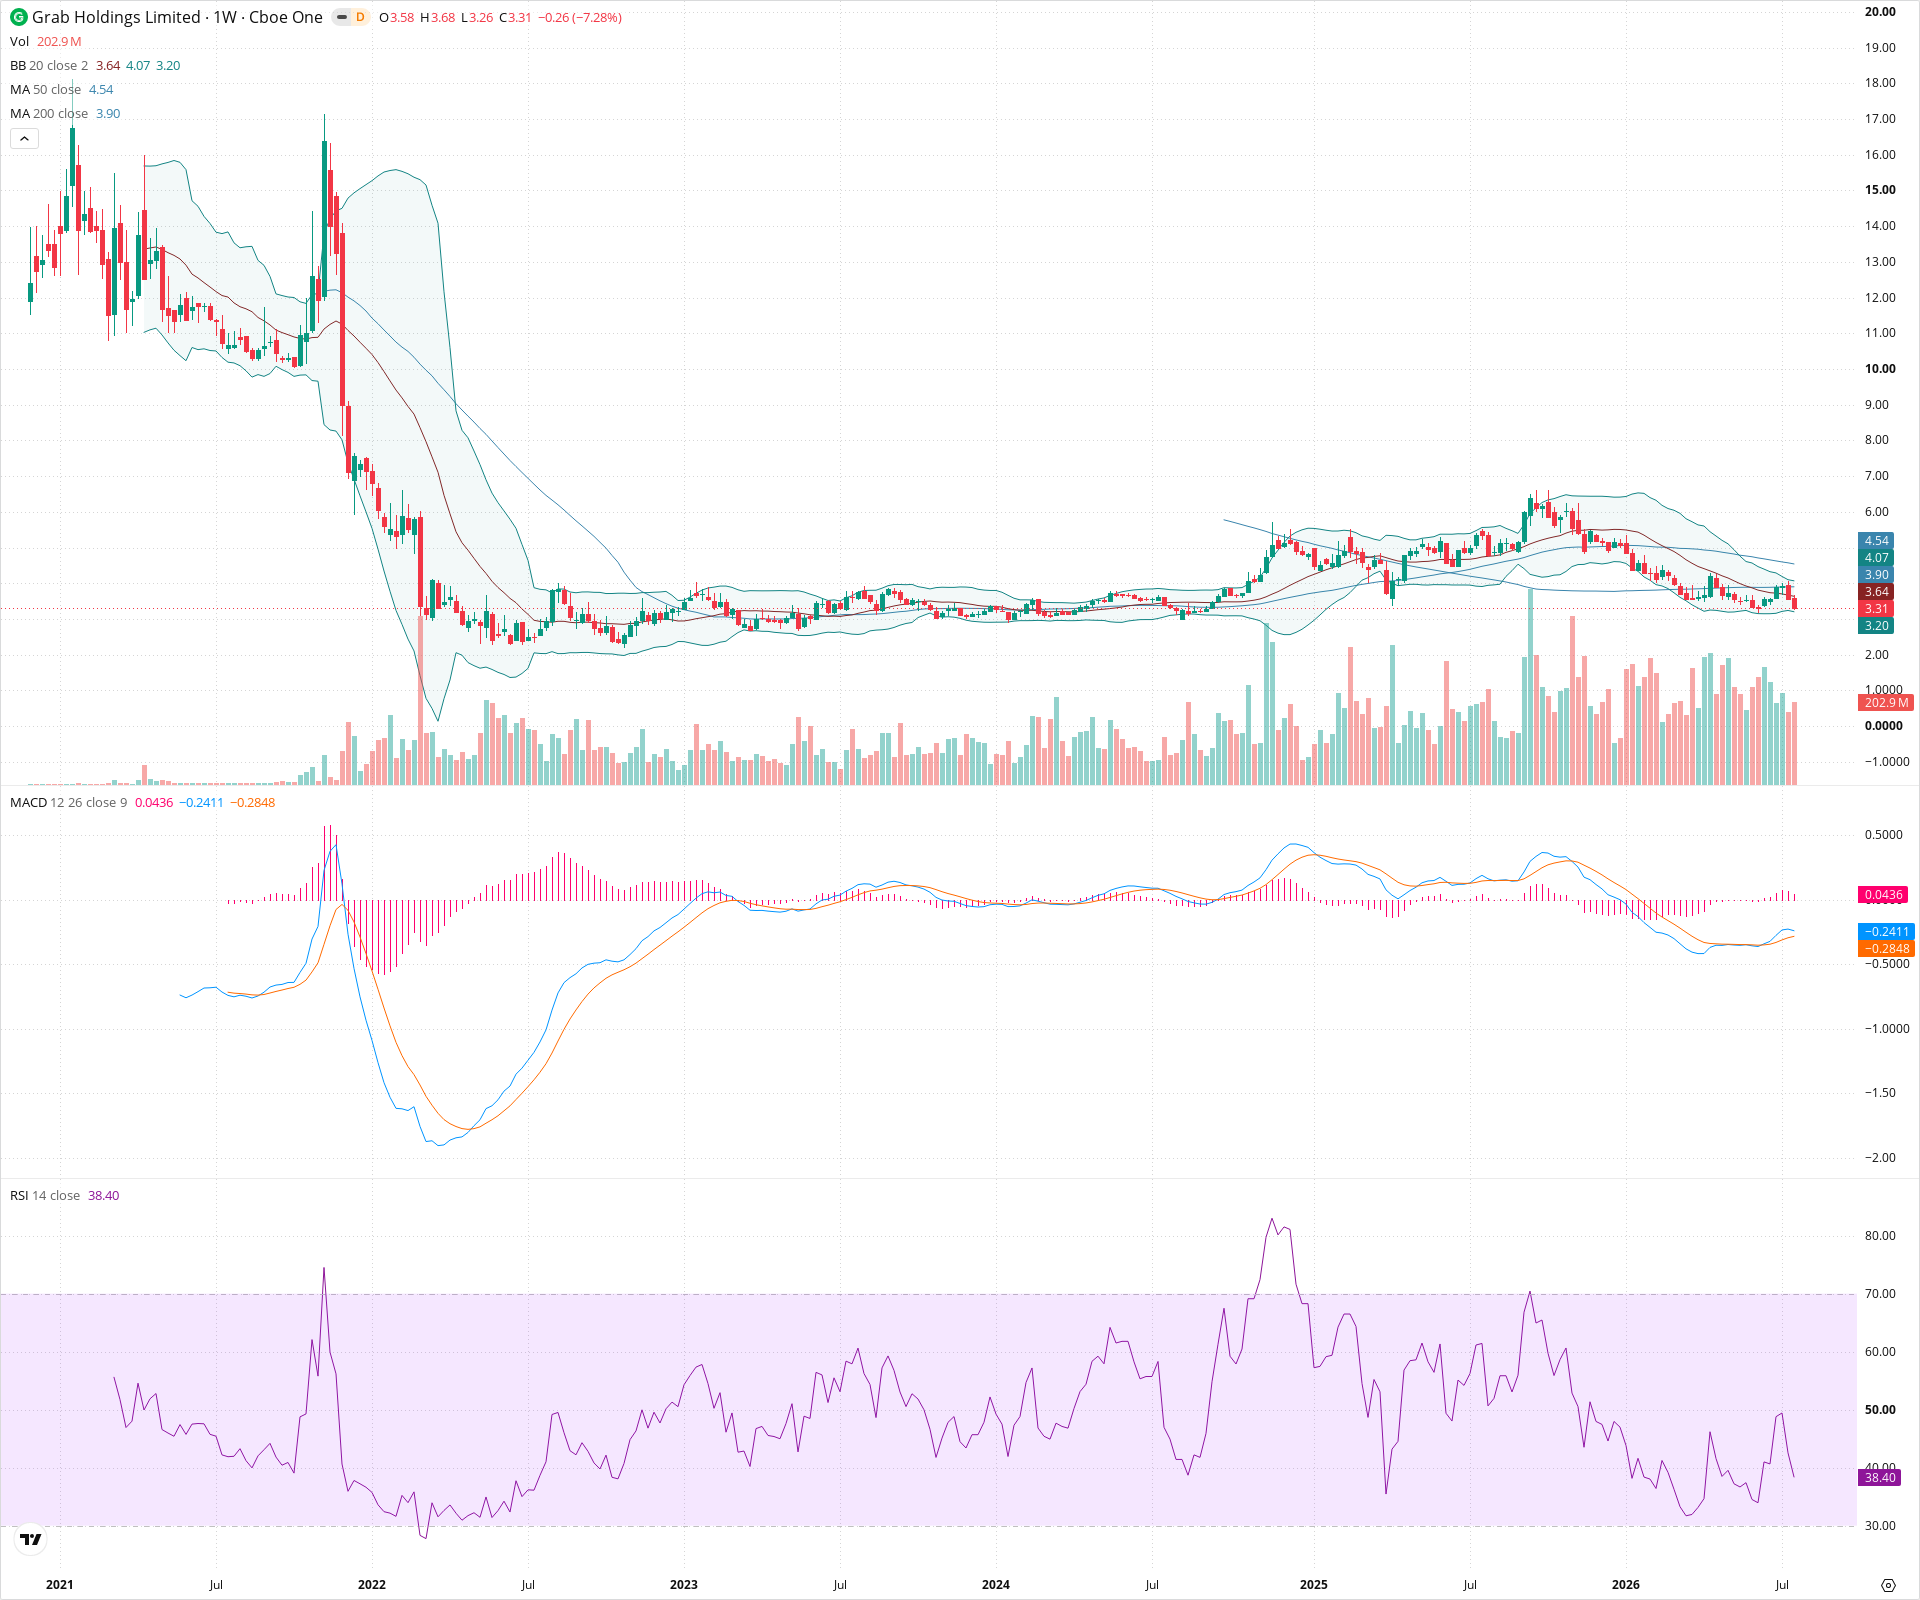
GRAB Weekly Chart
Sentiment
Short-term Sentiment (days to weeks): Bearish
Price is trading below the 20-week, 50-week, and 200-week SMAs. Recent price action shows a series of lower highs and lower lows, indicating downward momentum. RSI is pointing downwards towards the 30 level, and MACD histogram is negative and expanding.
Long-term Sentiment (weeks to months): Bearish
The long-term trend has been down since the significant drop in late 2021/early 2022. The stock has been trading in a multi-year consolidation range but is currently failing to break above the 200-week SMA and is trending towards the lower end of this range.
Report Metadata
- Timeframe: weekly
- Generated at: 2026-07-25T09:13:35.298Z
- Model: gemini-3.1-pro-preview
Support Price Levels
| Level | Range | Strength | Notes |
|---|---|---|---|
| $3.08 | $3.00 - $3.15 | Weak | Minor support area from recent consolidation and swing lows. |
| $2.65 | $2.50 - $2.80 | Strong | Multi-year absolute lows established during the consolidation phase. |
Resistance Price Levels
| Level | Range | Strength | Notes |
|---|---|---|---|
| $3.70 | $3.60 - $3.80 | Strong | Confluence of 20-week and 50-week SMAs, acting as near-term dynamic resistance. |
| $4.10 | $4.00 - $4.20 | Strong | Resistance zone near the 200-week SMA and recent swing highs. |
| $5.25 | $5.00 - $5.50 | Strong | Major overhead resistance from the top of the multi-year consolidation channel. |
Potential Chart Patterns in Formation
| Strength | Pattern | Signal | Target | Details |
|---|---|---|---|---|
| Weak | Descending Triangle (Potential) | Bearish | N/A | Price action since early 2024 shows lower highs, while horizontal support appears to be forming around the 3.00-3.15 area. |
| Strong | Multi-year Consolidation Box | Neutral | N/A | The stock has traded roughly between 2.50 and 5.50 for an extended period, following the initial major downtrend. |
Frequently Asked Questions about GRAB
What is the current sentiment for GRAB?
The short-term sentiment for GRAB is currently Bearish because Price is trading below the 20-week, 50-week, and 200-week SMAs. Recent price action shows a series of lower highs and lower lows, indicating downward momentum. RSI is pointing downwards towards the 30 level, and MACD histogram is negative and expanding.. The long-term trend is classified as Bearish.
What are the key support levels for GRAB?
StockDips.AI has identified key support levels for GRAB at $3.08 and $2.65. These levels may represent potential accumulation zones where buying interest could emerge.
Is GRAB in a significant dip or a Value Dip right now?
GRAB has a Value Score of 86/100. It is currently flagged as a significant dip in the Top Dips list. It is not listed as a Value Dip because the long-term sentiment or value-score threshold does not qualify.
View the full interactive analysis on StockDips.AI.