GRAB Monthly Technical Analysis
Grab Holdings Ltd
Southeast Asian super app offering ride-hailing, food delivery, and financial services.
GRAB Technical Analysis Summary
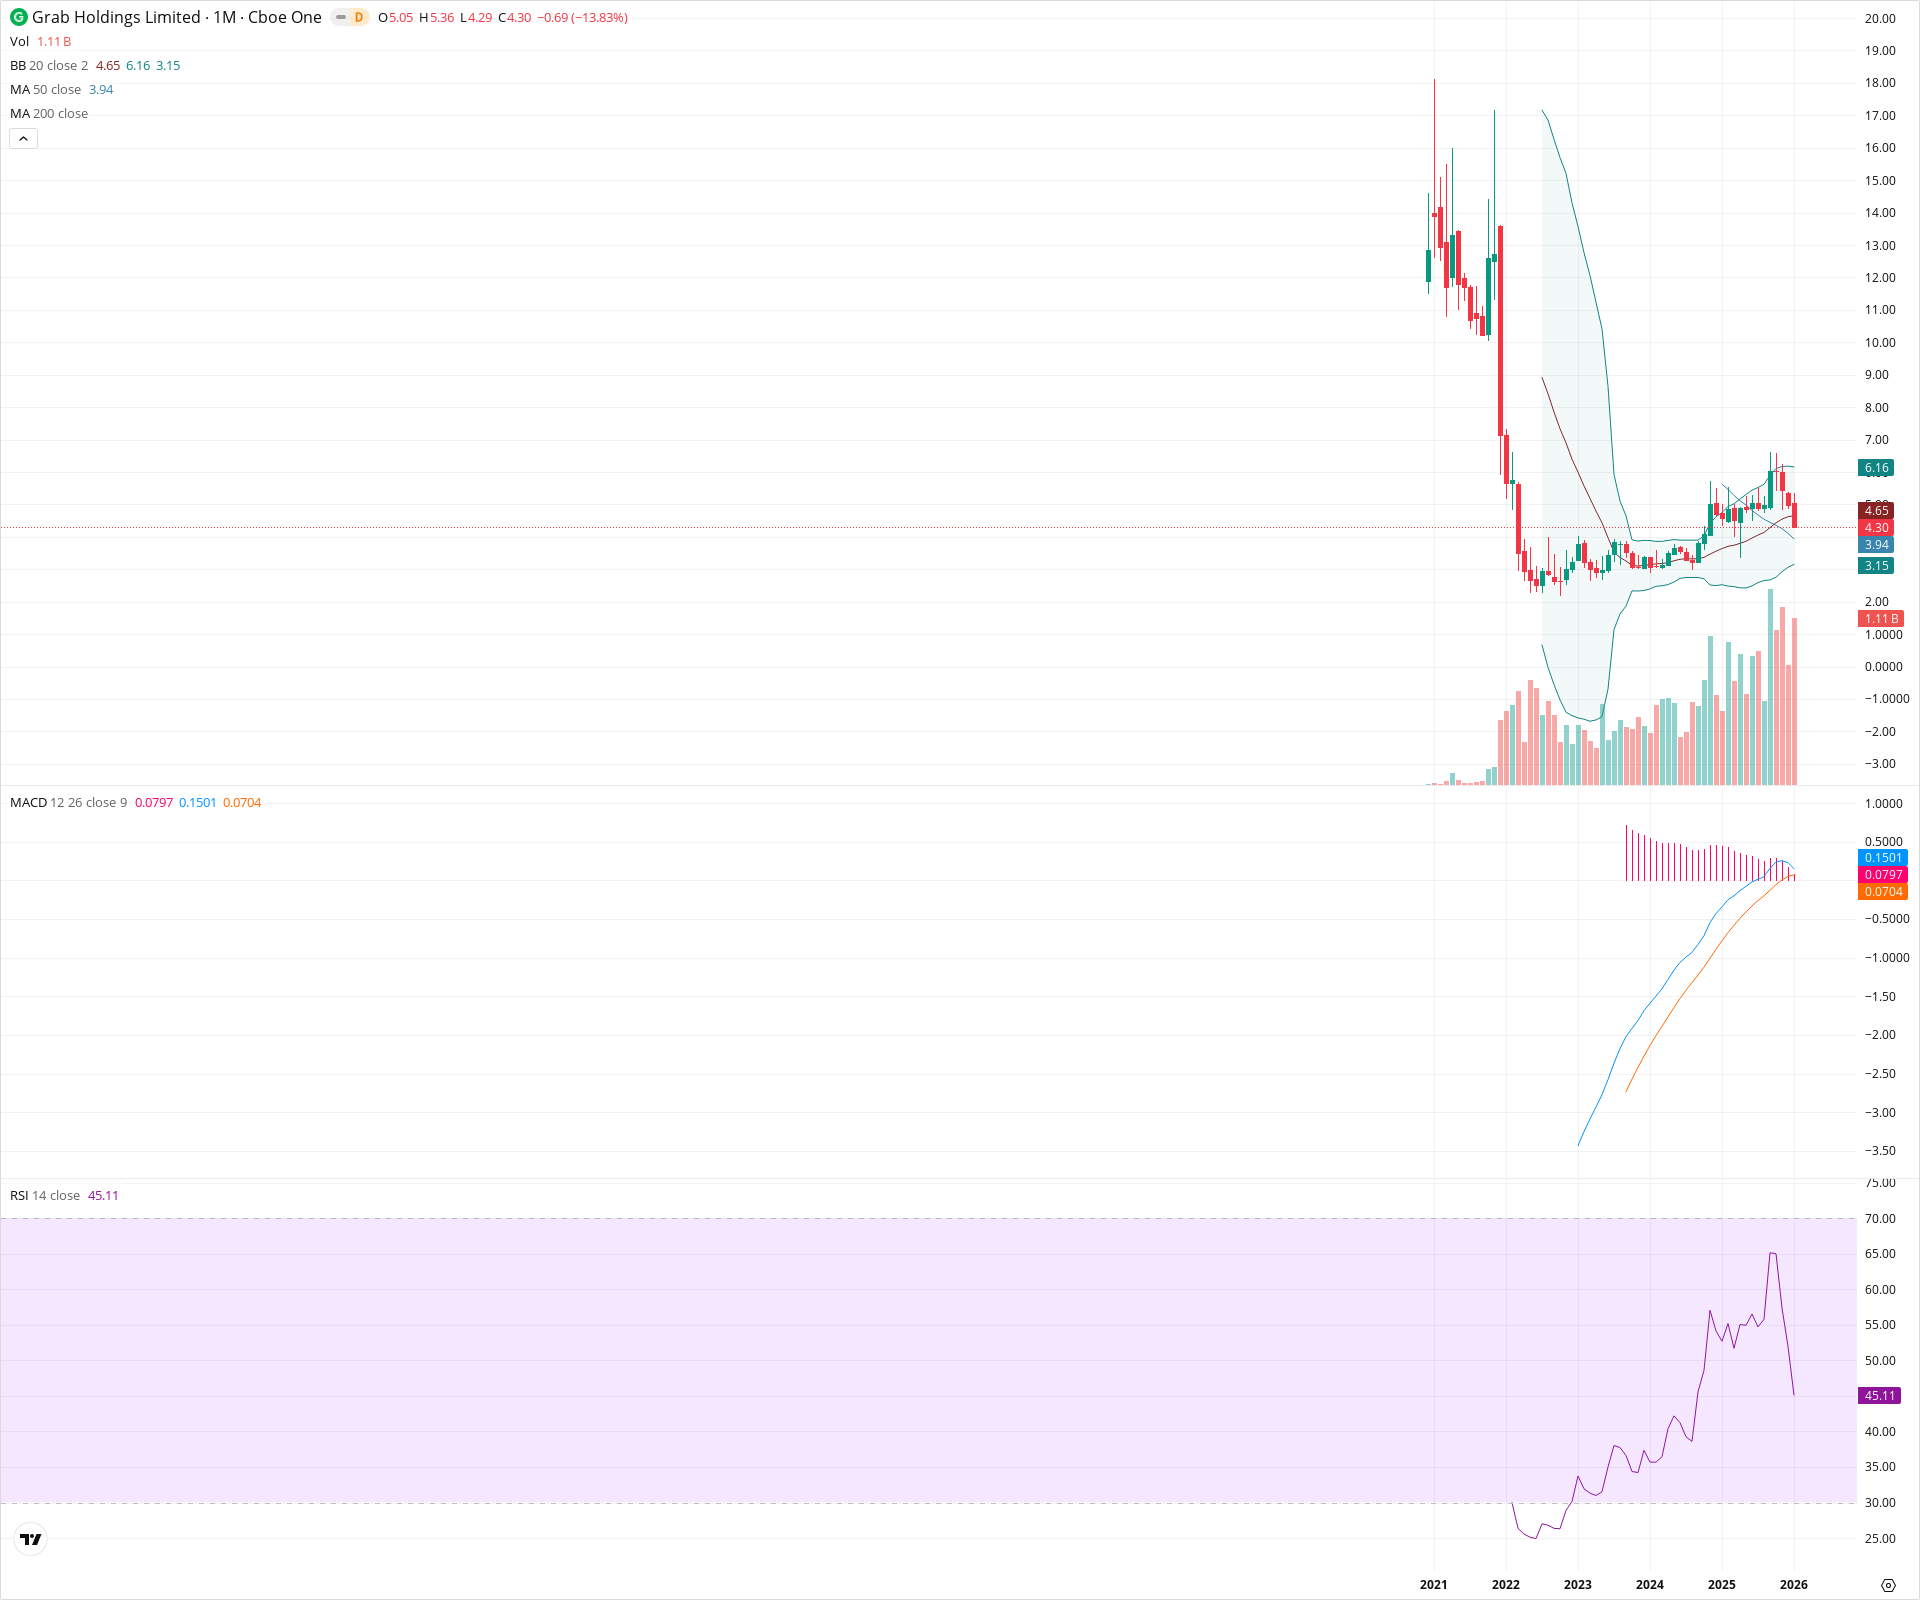
Grab Holdings has emerged from a prolonged accumulation phase, forming a clear rounding bottom with a breakout above the $4.00 level. Currently, the stock is undergoing a technical throwback, retesting the breakout zone and the rising 50-month SMA. While short-term momentum indicators like the MACD suggest caution, the long-term structural reversal remains valid as long as the price holds above the $3.80–$4.00 support zone.
Included In Lists
Related Tickers of Interest
GRAB Monthly Chart
Sentiment
Short-term Sentiment (days to weeks): Bearish
The stock is experiencing a sharp pullback (-13.83% this month), dropping below the 20-month SMA (4.65) and displaying a bearish MACD crossover with momentum declining.
Long-term Sentiment (weeks to months): Bullish
Price remains structurally constructive following a breakout from a multi-year base. The current pullback is testing the 50-month SMA (3.94) and previous resistance-turned-support, typical of a breakout retest.
Report Metadata
- Timeframe: monthly
- Generated at: 2026-02-02T06:23:55.310Z
- Model: gemini-3-pro-preview
Support Price Levels
| Level | Range | Strength | Notes |
|---|---|---|---|
| $3.90 | $3.80 - $4.00 | Strong | Confluence of the 50-month SMA and the upper boundary of the multi-year rounding bottom base. |
| $2.83 | $2.50 - $3.15 | Strong | Secular base lows and the Lower Bollinger Band area. |
Resistance Price Levels
| Level | Range | Strength | Notes |
|---|---|---|---|
| $4.68 | $4.65 - $4.70 | Weak | The 20-month SMA (Bollinger Band basis) which was recently lost. |
| $5.43 | $5.36 - $5.50 | Strong | Recent swing high marking the peak of the initial breakout move. |
| $6.18 | $6.16 - $6.20 | Weak | Upper Bollinger Band level. |
Potential Chart Patterns in Formation
| Strength | Pattern | Signal | Target | Details |
|---|---|---|---|---|
| Strong | Rounding Bottom / Base | Bullish | $5.50 | A multi-year accumulation base formed between 2022 and 2024 with resistance around $4.00. |
Frequently Asked Questions about GRAB
What is the current sentiment for GRAB?
The short-term sentiment for GRAB is currently Bearish because The stock is experiencing a sharp pullback (-13.83% this month), dropping below the 20-month SMA (4.65) and displaying a bearish MACD crossover with momentum declining.. The long-term trend is classified as Bullish.
What are the key support levels for GRAB?
StockDips.AI has identified key support levels for GRAB at $3.90 and $2.83. These levels may represent potential accumulation zones where buying interest could emerge.
Is GRAB in a significant dip or a Value Dip right now?
GRAB has a Value Score of 86/100. It is currently flagged as a significant dip in the Top Dips list. It is also listed as a Value Dip because long-term sentiment is bullish.
View the full interactive analysis on StockDips.AI.