HIMS Monthly Technical Analysis
Hims & Hers Health Inc
Telehealth company offering wellness, skincare, and mental health treatments online.
HIMS Technical Analysis Summary
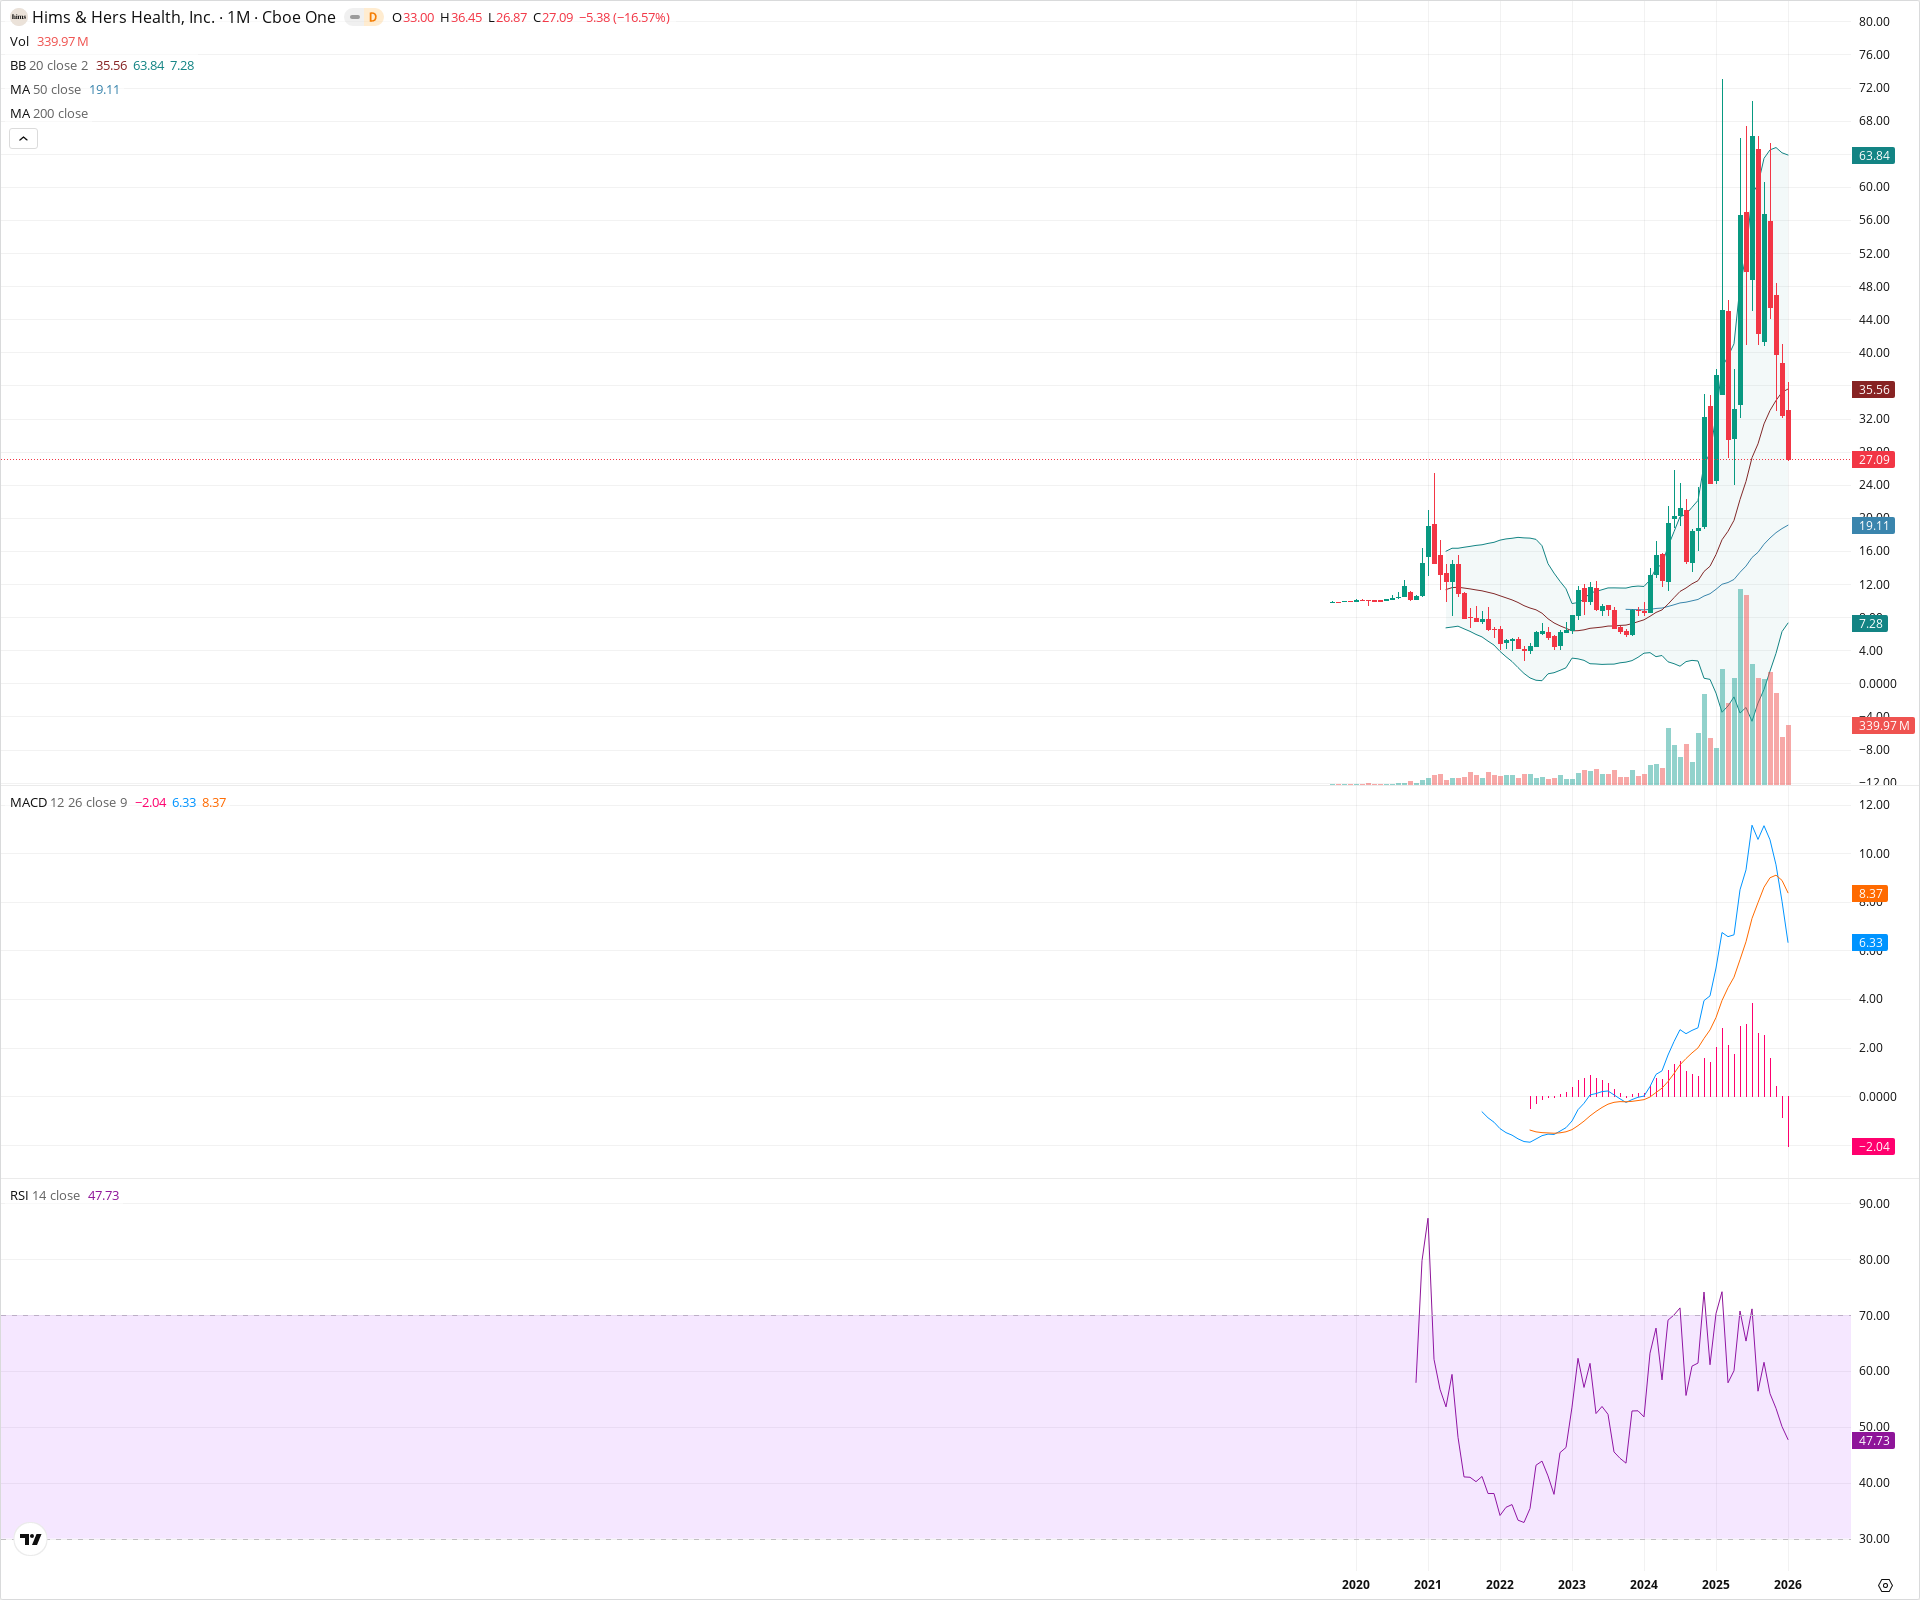
HIMS is undergoing a significant mean reversion correction after a parabolic advance, evidenced by a sharp monthly drop below the 20-month SMA and a confirmed bearish MACD crossover. The price is approaching a critical secular support zone near $25, which represents the 2021 highs; holding this level is essential to maintain the macro bullish structure. While the short-term momentum is decidedly negative, the rising 50-month SMA provides a major longer-term floor.
Included In Lists
Related Tickers of Interest
HIMS Monthly Chart
Sentiment
Short-term Sentiment (days to weeks): Bearish
The price has dropped sharply below the 20-month SMA (35.56), and the MACD has confirmed a bearish crossover with expanding negative histogram momentum.
Long-term Sentiment (weeks to months): Neutral
While the long-term trend remains structurally positive above the 50-month SMA (19.11), the loss of immediate momentum and the monthly MACD sell signal suggest a transition into a corrective or consolidation regime.
Report Metadata
- Timeframe: monthly
- Generated at: 2026-02-02T06:24:25.015Z
- Model: gemini-3-pro-preview
Support Price Levels
| Level | Range | Strength | Notes |
|---|---|---|---|
| $24.75 | $24.00 - $25.50 | Strong | Former secular all-time high from 2021 acting as a key polarity flip/retest zone. |
| $19.25 | $19.00 - $19.50 | Strong | Confluence of the rising 50-month SMA and prior consolidation resistance. |
| $12.50 | $12.00 - $13.00 | Weak | Upper boundary of the multi-year base structure. |
Resistance Price Levels
| Level | Range | Strength | Notes |
|---|---|---|---|
| $36.00 | $35.50 - $36.50 | Strong | Confluence of the 20-month SMA and the recent monthly high. |
| $41.00 | $40.00 - $42.00 | Weak | Psychological level and potential upper volatility limit near recent wicks. |
Potential Chart Patterns in Formation
| Strength | Pattern | Signal | Target | Details |
|---|---|---|---|---|
| Strong | Parabolic Retracement | Bearish | $19.11 | After a steep vertical ascent, the price is undergoing a mean reversion correction, breaking the steep trendline. |
| Strong | Cup and Handle Breakout (Retest) | Bullish | N/A | The stock broke out of a massive multi-year rounding bottom (cup) and is now pulling back to potentially retest the breakout rim. |
Frequently Asked Questions about HIMS
What is the current sentiment for HIMS?
The short-term sentiment for HIMS is currently Bearish because The price has dropped sharply below the 20-month SMA (35.56), and the MACD has confirmed a bearish crossover with expanding negative histogram momentum.. The long-term trend is classified as Neutral.
What are the key support levels for HIMS?
StockDips.AI has identified key support levels for HIMS at $24.75 and $19.25. These levels may represent potential accumulation zones where buying interest could emerge.
Is HIMS in a significant dip or a Value Dip right now?
HIMS has a Value Score of 47/100. It is not currently flagged as a significant dip in the Top Dips list. It is not listed as a Value Dip because the long-term sentiment or value-score threshold does not qualify.
View the full interactive analysis on StockDips.AI.