LFMD Daily Technical Analysis
LifeMD Inc
Telehealth company offering online medical consultations and prescription treatments.
LFMD Technical Analysis Summary
LFMD has experienced a severe technical breakdown, marked by a decisive drop below major support at $4.20 and the critical 200-day moving average. This price action completes a multi-month Head and Shoulders topping pattern, indicating a shift from a long-term uptrend to a new downtrend. With momentum indicators like MACD accelerating negatively, the path of least resistance remains downward, likely targeting the next major support zone near $3.00 unless bulls can quickly reclaim the broken $4.20 level.
Included In Lists
Related Tickers of Interest
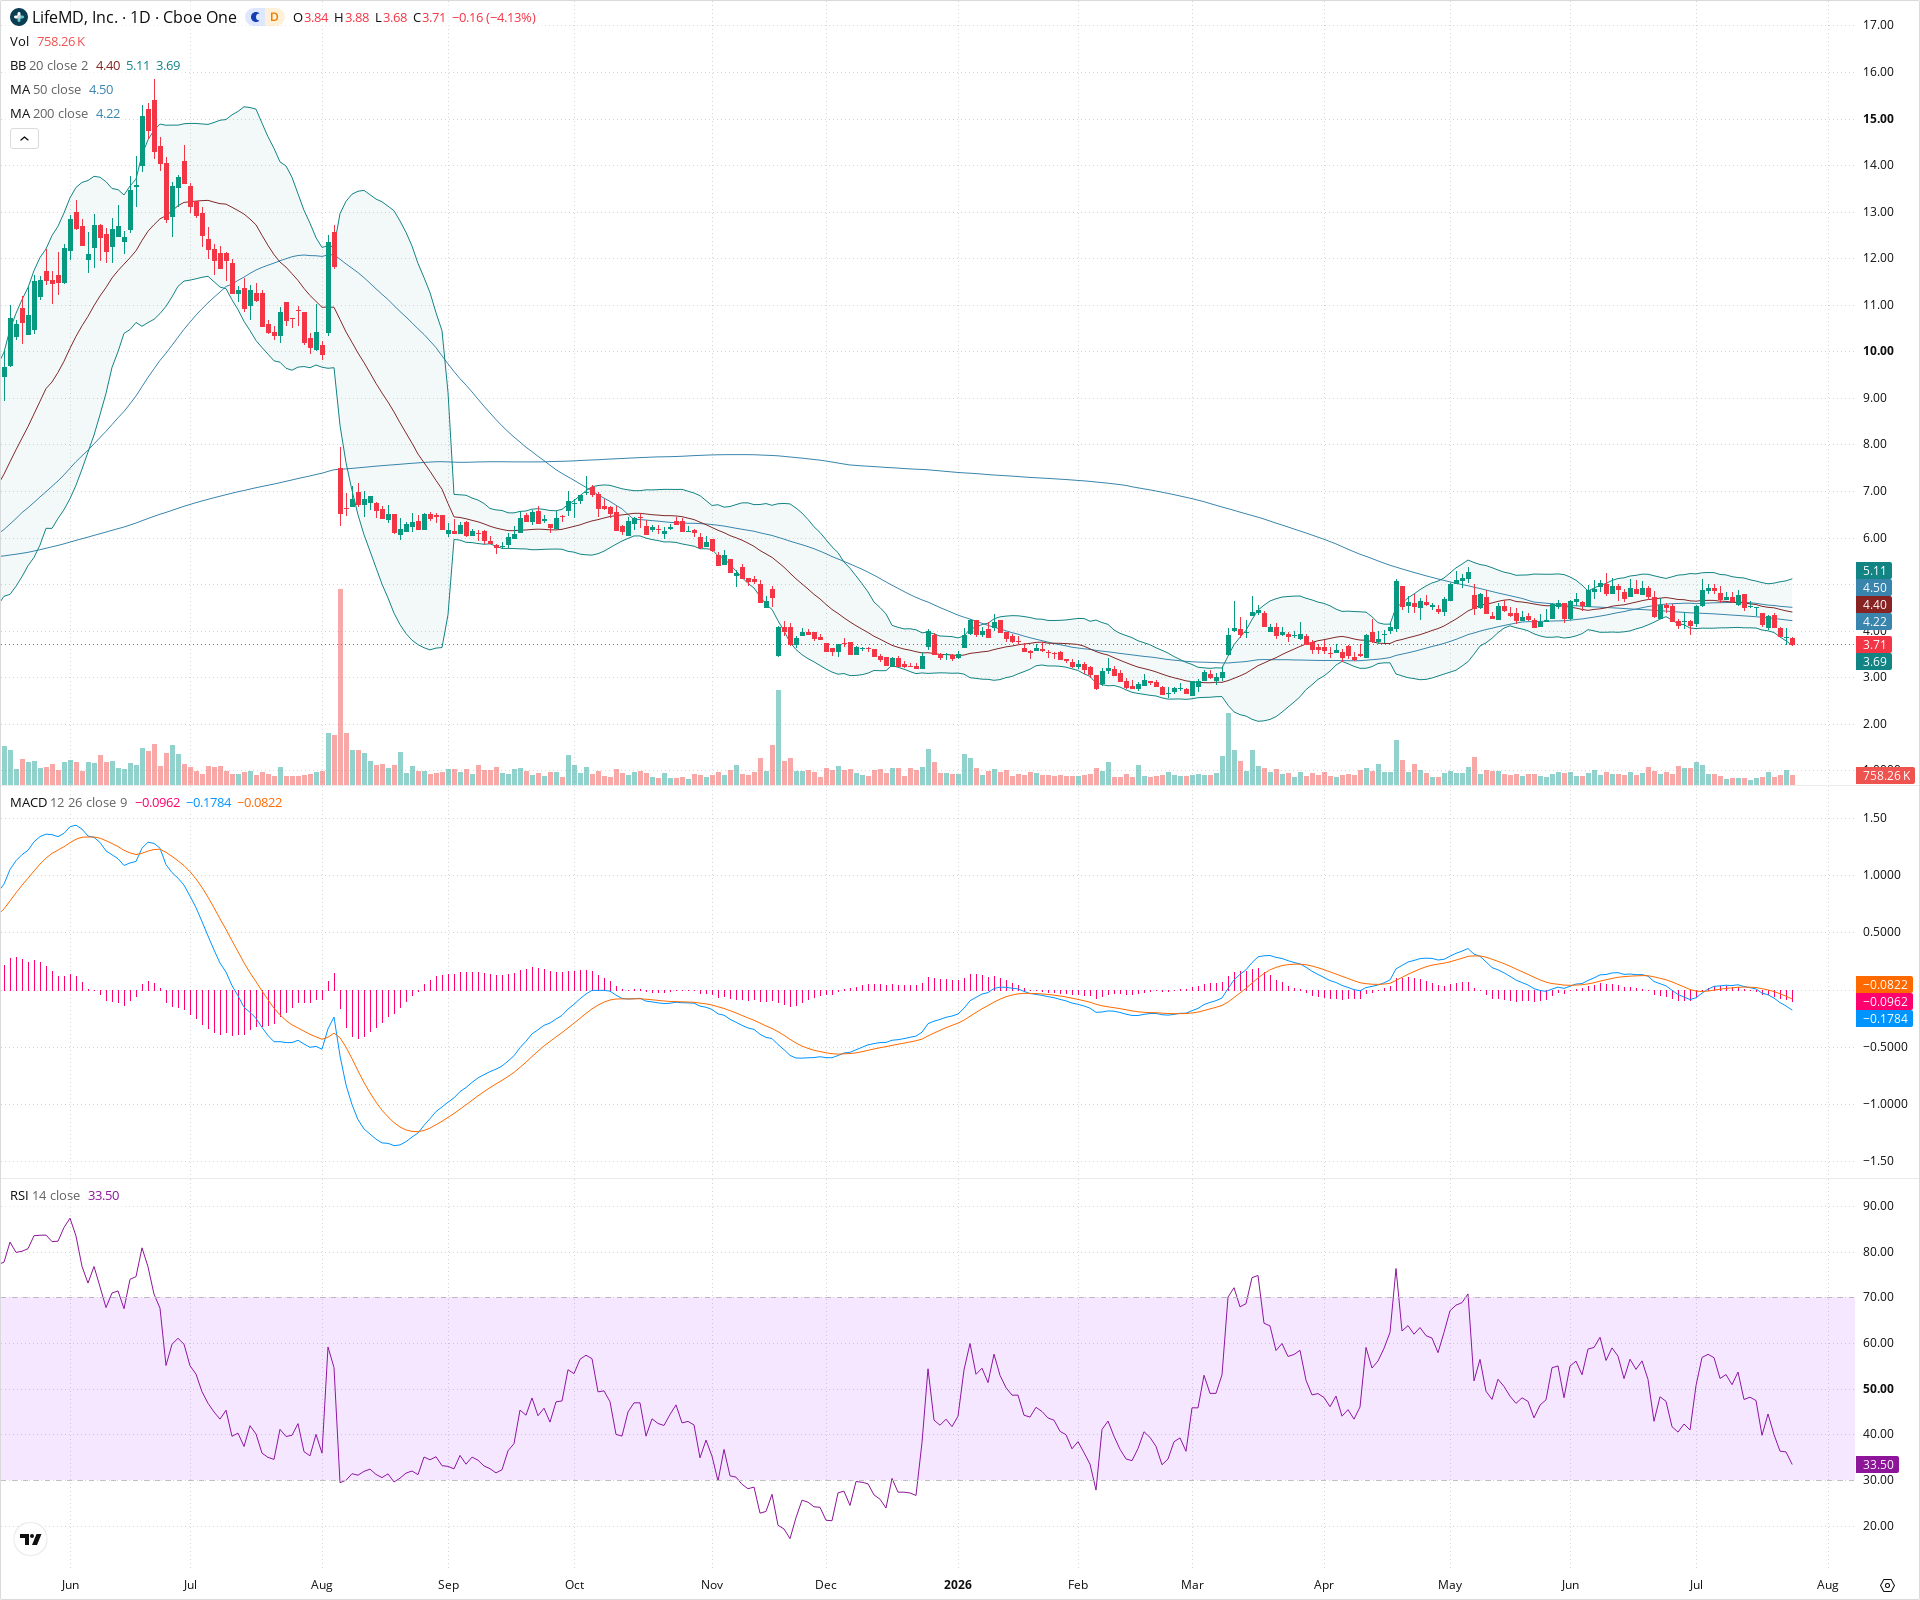
LFMD Daily Chart
Sentiment
Short-term Sentiment (days to weeks): Bearish
Price is in a steep short-term downtrend, making lower highs and lower lows. It is currently riding the lower Bollinger Band, with RSI dropping rapidly toward oversold territory (33.50). MACD shows a bearish crossover with an expanding negative histogram, confirming strong downward momentum.
Long-term Sentiment (weeks to months): Bearish
The stock has decisively broken below its 200-day simple moving average and lost a major structural support level around $4.00-$4.20. The breakdown of this multi-month distribution phase suggests a significant trend reversal from the prior uptrend.
Report Metadata
- Timeframe: daily
- Generated at: 2026-07-24T21:04:58.800Z
- Model: gemini-3.1-pro-preview
Support Price Levels
| Level | Range | Strength | Notes |
|---|---|---|---|
| $3.10 | $3.00 - $3.20 | Strong | Major prior swing low consolidation area from late January and early February before the large spring rally. |
| $2.25 | $2.00 - $2.50 | Strong | Deep, long-term base building consolidation zone from October through December of the previous year. |
Resistance Price Levels
| Level | Range | Strength | Notes |
|---|---|---|---|
| $4.13 | $4.00 - $4.25 | Strong | Previous major support neckline that recently failed, now acts as strong resistance. Also coincides with the current location of the 200-day SMA (4.22). |
| $4.50 | $4.40 - $4.60 | Weak | Near-term resistance defined by the descending 20-day (4.40) and 50-day (4.50) moving averages. |
| $5.35 | $5.20 - $5.50 | Strong | Recent major swing highs and the 'head' of the broad topping structure. |
Potential Chart Patterns in Formation
| Strength | Pattern | Signal | Target | Details |
|---|---|---|---|---|
| Strong | Head and Shoulders Top | Bearish | $2.90 | A complex topping structure formed between April and July. The stock recently broke down below the neckline support (around $4.00-$4.20), confirming a bearish trend reversal pattern. |
Frequently Asked Questions about LFMD
What is the current sentiment for LFMD?
The short-term sentiment for LFMD is currently Bearish because Price is in a steep short-term downtrend, making lower highs and lower lows. It is currently riding the lower Bollinger Band, with RSI dropping rapidly toward oversold territory (33.50). MACD shows a bearish crossover with an expanding negative histogram, confirming strong downward momentum.. The long-term trend is classified as Bearish.
What are the key support levels for LFMD?
StockDips.AI has identified key support levels for LFMD at $3.10 and $2.25. These levels may represent potential accumulation zones where buying interest could emerge.
Is LFMD in a significant dip or a Value Dip right now?
LFMD has a Value Score of 40/100. It is not currently flagged as a significant dip in the Top Dips list. It is not listed as a Value Dip because the long-term sentiment or value-score threshold does not qualify.
View the full interactive analysis on StockDips.AI.