HOOD Monthly Technical Analysis
Robinhood Markets Inc
Retail brokerage app offering commission-free stock, options, and crypto trading.
HOOD Technical Analysis Summary
HOOD has undergone a dramatic regime change from a dormant accumulation phase to a high-volatility markup phase. While the long-term trend remains bullish with momentum confirmed by the MACD and rising SMAs, the immediate price action reflects a necessary correction of a parabolic move. Investors should watch the interaction with the 20-month SMA for signs of stabilization.
Included In Lists
Related Tickers of Interest
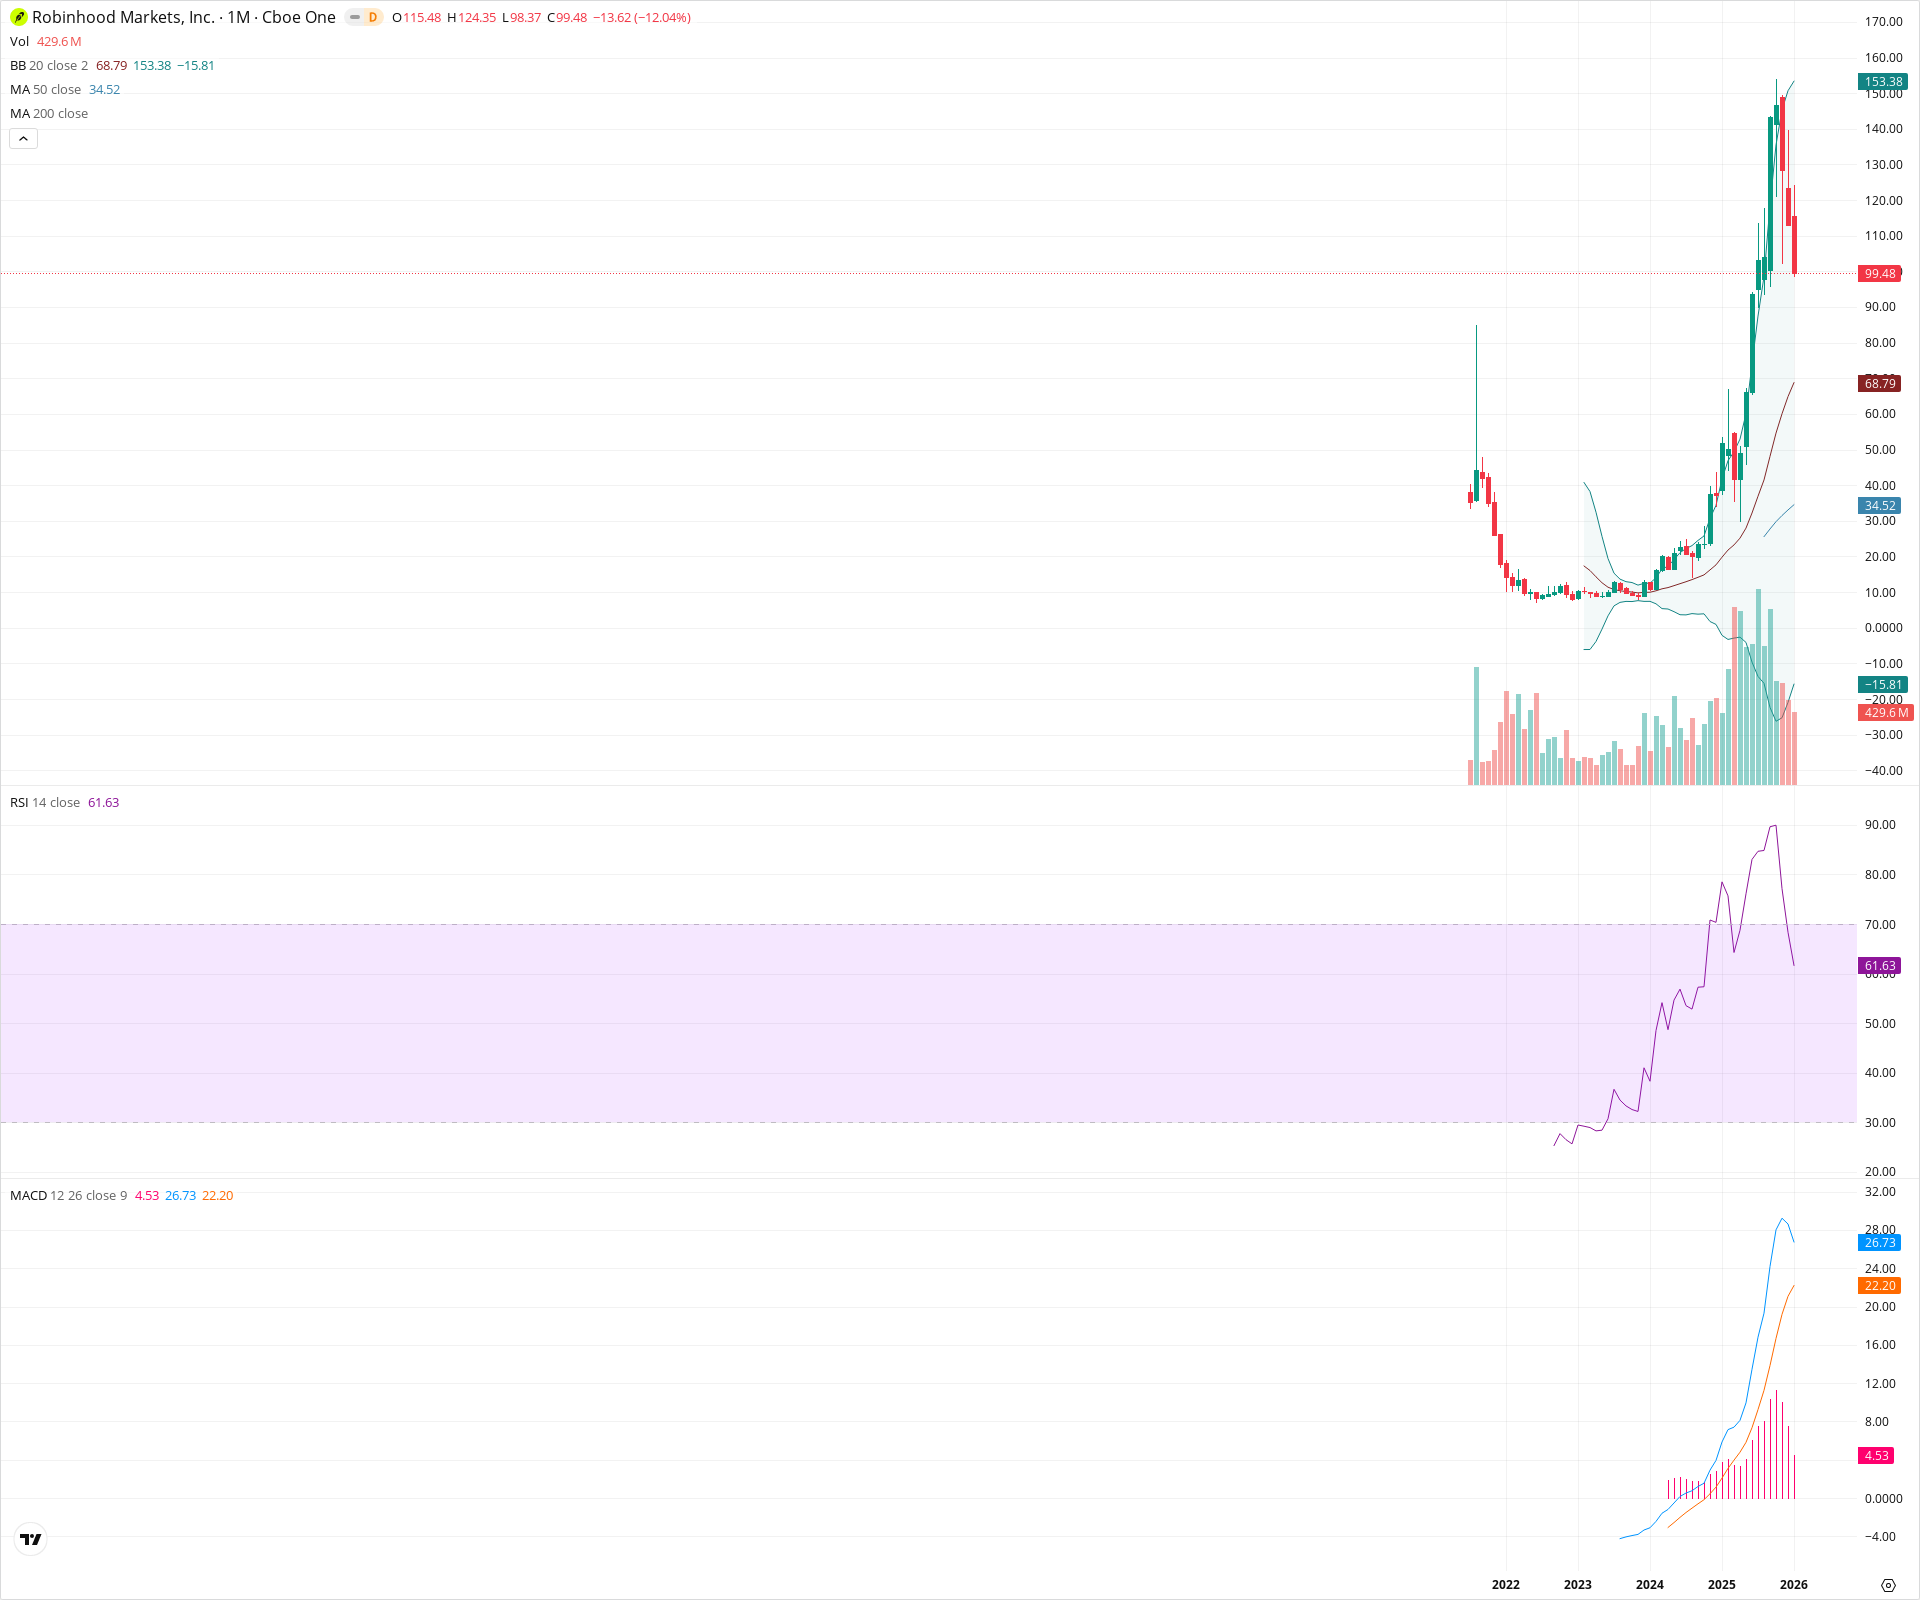
HOOD Monthly Chart
Sentiment
Short-term Sentiment (days to weeks): Bearish
The current monthly candle is a significant red bar showing a -12% decline, indicating a sharp correction and profit-taking following a parabolic extension.
Long-term Sentiment (weeks to months): Bullish
The stock has successfully broken out of a multi-year accumulation base. Major moving averages (20 and 50 SMAs) are trending up, and the MACD is in a strong positive regime above the zero line.
Report Metadata
- Timeframe: monthly
- Generated at: 2026-02-02T06:24:26.812Z
- Model: gemini-3-pro-preview
Support Price Levels
| Level | Range | Strength | Notes |
|---|---|---|---|
| $67.50 | $65.00 - $70.00 | Strong | Coincides with the rising 20-period SMA (currently ~68.79), acting as the first major mean reversion support level. |
| $32.50 | $30.00 - $35.00 | Strong | Major structural breakout zone and location of the 50-period SMA. |
| $10.00 | $7.00 - $13.00 | Strong | Historical secular floor and long-term consolidation base. |
Resistance Price Levels
| Level | Range | Strength | Notes |
|---|---|---|---|
| $124.50 | $124.00 - $125.00 | Weak | High of the current monthly candle. |
| $157.50 | $150.00 - $165.00 | Strong | Recent cycle highs and upper Bollinger Band area where the parabolic move was rejected. |
Potential Chart Patterns in Formation
| Strength | Pattern | Signal | Target | Details |
|---|---|---|---|---|
| Strong | Rounding Bottom Breakout | Bullish | N/A | A multi-year accumulation phase (saucer shape) from 2022 through 2023 that resolved into a high-momentum breakout in 2024. |
| Strong | Parabolic Extension & Correction | Bearish | $68.79 | Price went vertical well above the upper Bollinger Band, leading to a mean-reversion snapback (current red candle). |
Frequently Asked Questions about HOOD
What is the current sentiment for HOOD?
The short-term sentiment for HOOD is currently Bearish because The current monthly candle is a significant red bar showing a -12% decline, indicating a sharp correction and profit-taking following a parabolic extension.. The long-term trend is classified as Bullish.
What are the key support levels for HOOD?
StockDips.AI has identified key support levels for HOOD at $67.50 and $32.50. These levels may represent potential accumulation zones where buying interest could emerge.
Is HOOD in a significant dip or a Value Dip right now?
HOOD has a Value Score of 84/100. It is currently flagged as a significant dip in the Top Dips list. It is also listed as a Value Dip because long-term sentiment is bullish.
View the full interactive analysis on StockDips.AI.