HUT Monthly Technical Analysis
Hut 8 Corp
North American digital asset mining and infrastructure company focused on Bitcoin mining and high-performance computing data centers. Following its merger with US Bitcoin Corp, Hut 8 operates large-scale mining facilities and provides hosting and infrastructure services.
HUT Technical Analysis Summary
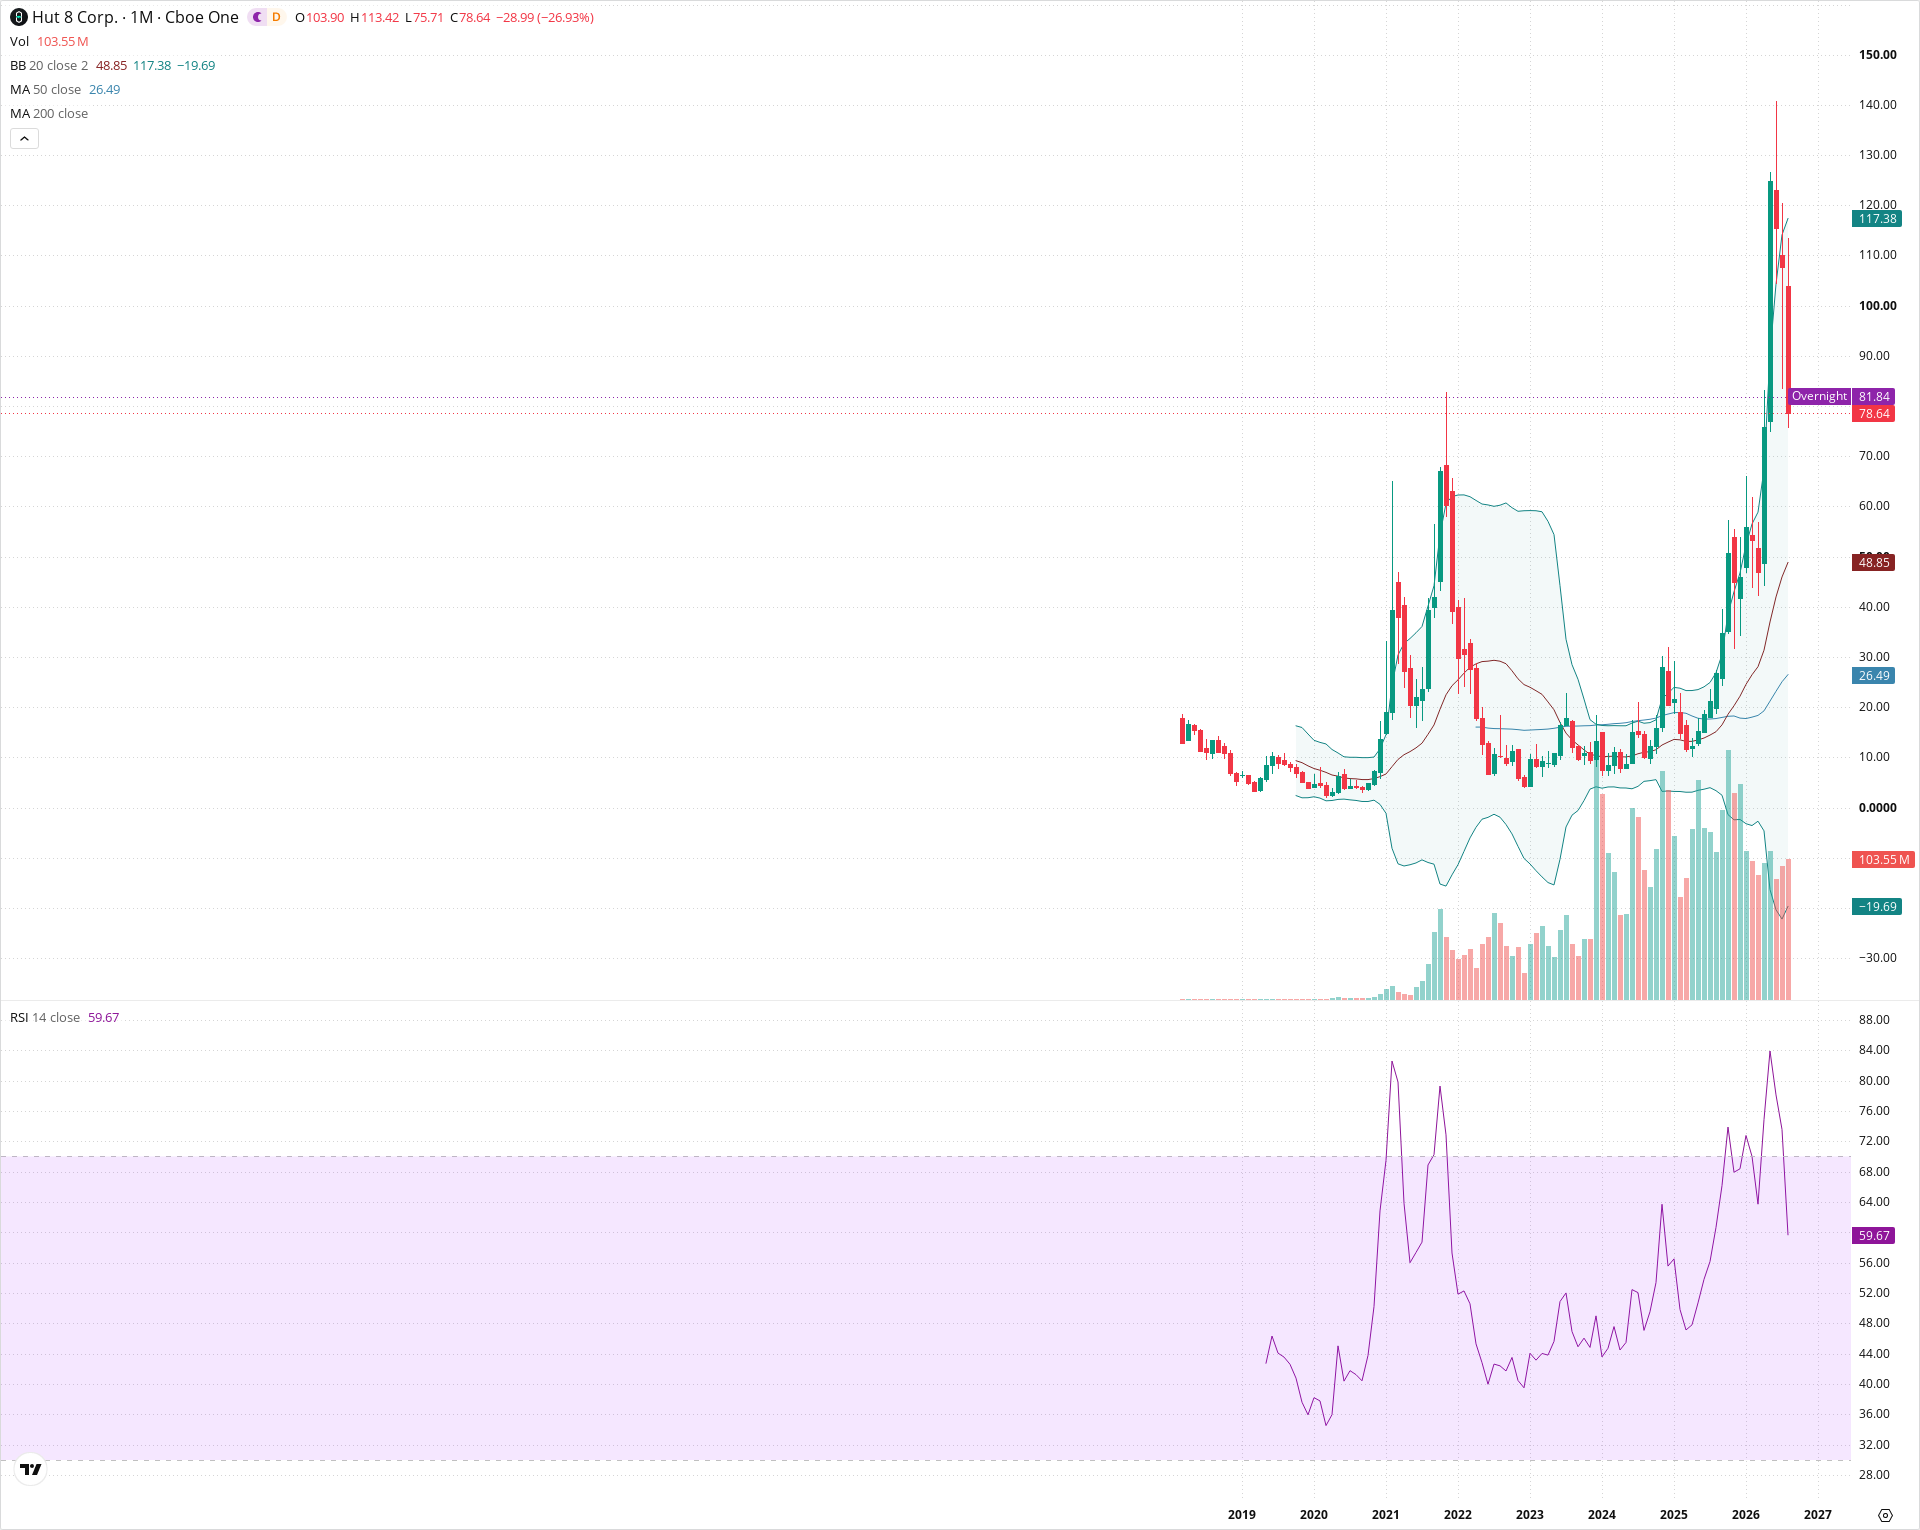
Hut 8 remains in a dominant secular bull market following a decisive multi-year base breakout that propelled price to new all-time highs above 140. While the current monthly bar exhibits heavy short-term profit taking and corrective pressure, price is testing critical polarity support at the 2021 peak near 78. As long as price holds above the 20-month SMA near 48.85, the broader multi-year macro uptrend remains firmly intact.
Included In Lists
Related Tickers of Interest
HUT Monthly Chart
Sentiment
Short-term Sentiment (days to weeks): Neutral
Price is experiencing a sharp monthly pullback from its recent peak near 140, testing the major multi-year breakout level around 75–80 while RSI normalizes toward 60.
Long-term Sentiment (weeks to months): Bullish
Price structure remains in a strong secular uptrend well above the rising 20-month and 50-month moving averages following an explosive multi-year base breakout.
Report Metadata
- Timeframe: monthly
- Generated at: 2026-09-01T06:41:55.258Z
- Model: gemini-3.7-flash
Support Price Levels
| Level | Range | Strength | Notes |
|---|---|---|---|
| $75.00 | $70.00 - $80.00 | Strong | Previous 2021 all-time high resistance zone, now acting as primary secular breakout retest support. |
| $50.00 | $45.00 - $55.00 | Strong | Confluence of the rising 20-month SMA (Bollinger middle band) and intermediate consolidation highs. |
Resistance Price Levels
| Level | Range | Strength | Notes |
|---|---|---|---|
| $120.00 | $115.00 - $125.00 | Weak | Upper Bollinger Band region and recent monthly open/close cluster. |
| $142.50 | $135.00 - $150.00 | Strong | Major multi-year high and extended wick peak representing secular blow-off resistance. |
Potential Chart Patterns in Formation
| Strength | Pattern | Signal | Target | Details |
|---|---|---|---|---|
| Strong | Secular Base Breakout | Bullish | $150.00 | Explosive breakout from a multi-year accumulation base (2022–2024) that cleared the 2021 secular highs and expanded volatility. |
Frequently Asked Questions about HUT
What is the current sentiment for HUT?
The short-term sentiment for HUT is currently Neutral because Price is experiencing a sharp monthly pullback from its recent peak near 140, testing the major multi-year breakout level around 75–80 while RSI normalizes toward 60.. The long-term trend is classified as Bullish.
What are the key support levels for HUT?
StockDips.AI has identified key support levels for HUT at $75.00 and $50.00. These levels may represent potential accumulation zones where buying interest could emerge.
Is HUT in a significant dip or a Value Dip right now?
HUT has a Value Score of 48/100. It is not currently flagged as a significant dip in the Top Dips list. It is not listed as a Value Dip because the long-term sentiment or value-score threshold does not qualify.
View the full interactive analysis on StockDips.AI.