LFMD Monthly Technical Analysis
LifeMD Inc
Telehealth company offering online medical consultations and prescription treatments.
LFMD Technical Analysis Summary
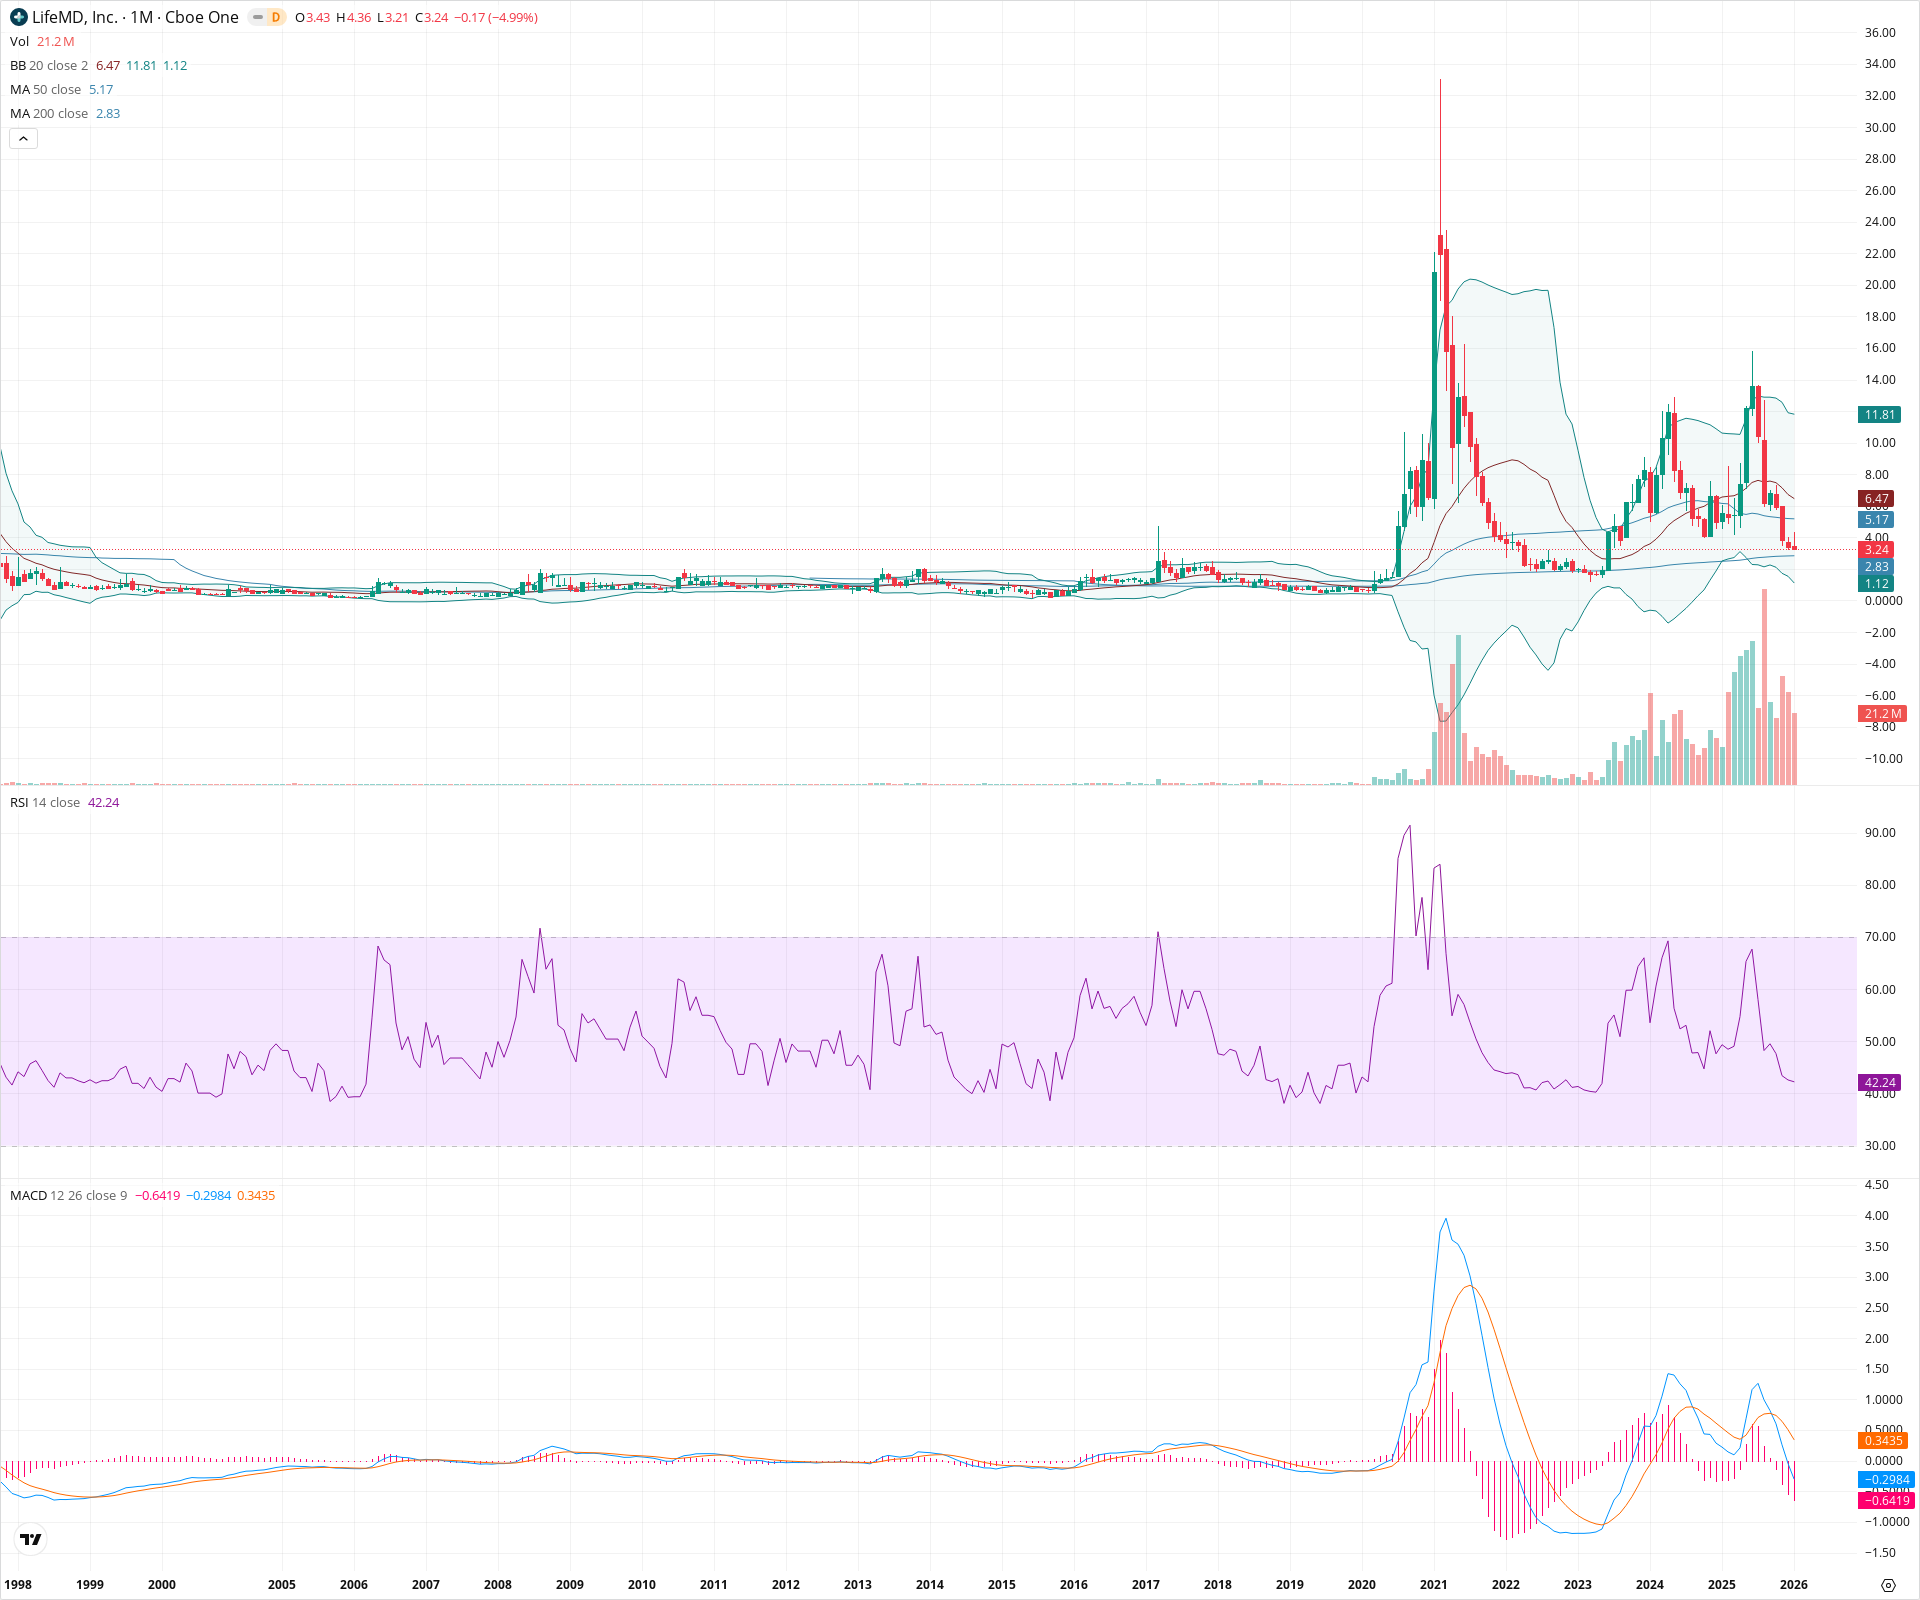
LifeMD is in a confirmed monthly downtrend having retraced the entirety of its recent gains to trade back near multi-year lows. The price is currently testing critical support at the 200-month SMA ($2.83); a failure to hold this level would likely precipitate a drop toward the 2022 secular lows around $1.80. Momentum indicators strongly support the bearish case, with the MACD line crossing below the signal line and RSI trending lower without yet being oversold.
Included In Lists
Related Tickers of Interest
LFMD Monthly Chart
Sentiment
Short-term Sentiment (days to weeks): Bearish
Price has declined sharply over the last several months, breaking below the 20-month and 50-month SMAs. Momentum is negative with a bearish MACD crossover and expanding negative histogram.
Long-term Sentiment (weeks to months): Bearish
The stock failed to sustain its recovery rally from 2023, forming a lower high relative to the 2021 peak. It is currently threatening to break the long-term 200-month SMA support, suggesting a resumption of the broader secular downtrend.
Report Metadata
- Timeframe: monthly
- Generated at: 2026-02-02T06:45:23.815Z
- Model: gemini-3-pro-preview
Support Price Levels
| Level | Range | Strength | Notes |
|---|---|---|---|
| $2.83 | $2.80 - $2.85 | Strong | Aligns with the 200-month SMA (currently 2.83), acting as the last major dynamic support. |
| $1.85 | $1.70 - $2.00 | Strong | Major secular swing lows from 2022 and historical base area. |
| $1.15 | $1.10 - $1.20 | Weak | Aligns with the current lower Bollinger Band. |
Resistance Price Levels
| Level | Range | Strength | Notes |
|---|---|---|---|
| $5.18 | $5.10 - $5.25 | Strong | Coincides with the 50-month SMA (5.17) which previously acted as support. |
| $10.00 | $9.50 - $10.50 | Strong | Significant breakdown level and psychological round number area from mid-2024. |
| $13.25 | $13.00 - $13.50 | Strong | The swing high of the failed 2024 recovery rally. |
Potential Chart Patterns in Formation
| Strength | Pattern | Signal | Target | Details |
|---|---|---|---|---|
| Strong | Rounding Top / Failed Recovery | Bearish | $1.80 | After a recovery rally in 2023-2024, price formed a rounded top and collapsed, failing to reclaim the 2021 highs. |
Frequently Asked Questions about LFMD
What is the current sentiment for LFMD?
The short-term sentiment for LFMD is currently Bearish because Price has declined sharply over the last several months, breaking below the 20-month and 50-month SMAs. Momentum is negative with a bearish MACD crossover and expanding negative histogram.. The long-term trend is classified as Bearish.
What are the key support levels for LFMD?
StockDips.AI has identified key support levels for LFMD at $2.83 and $1.85. These levels may represent potential accumulation zones where buying interest could emerge.
Is LFMD in a significant dip or a Value Dip right now?
LFMD has a Value Score of 40/100. It is not currently flagged as a significant dip in the Top Dips list. It is not listed as a Value Dip because the long-term sentiment or value-score threshold does not qualify.
View the full interactive analysis on StockDips.AI.