MELI Weekly Technical Analysis
MercadoLibre Inc
Latin America's leading e-commerce and digital payments company.
MELI Technical Analysis Summary
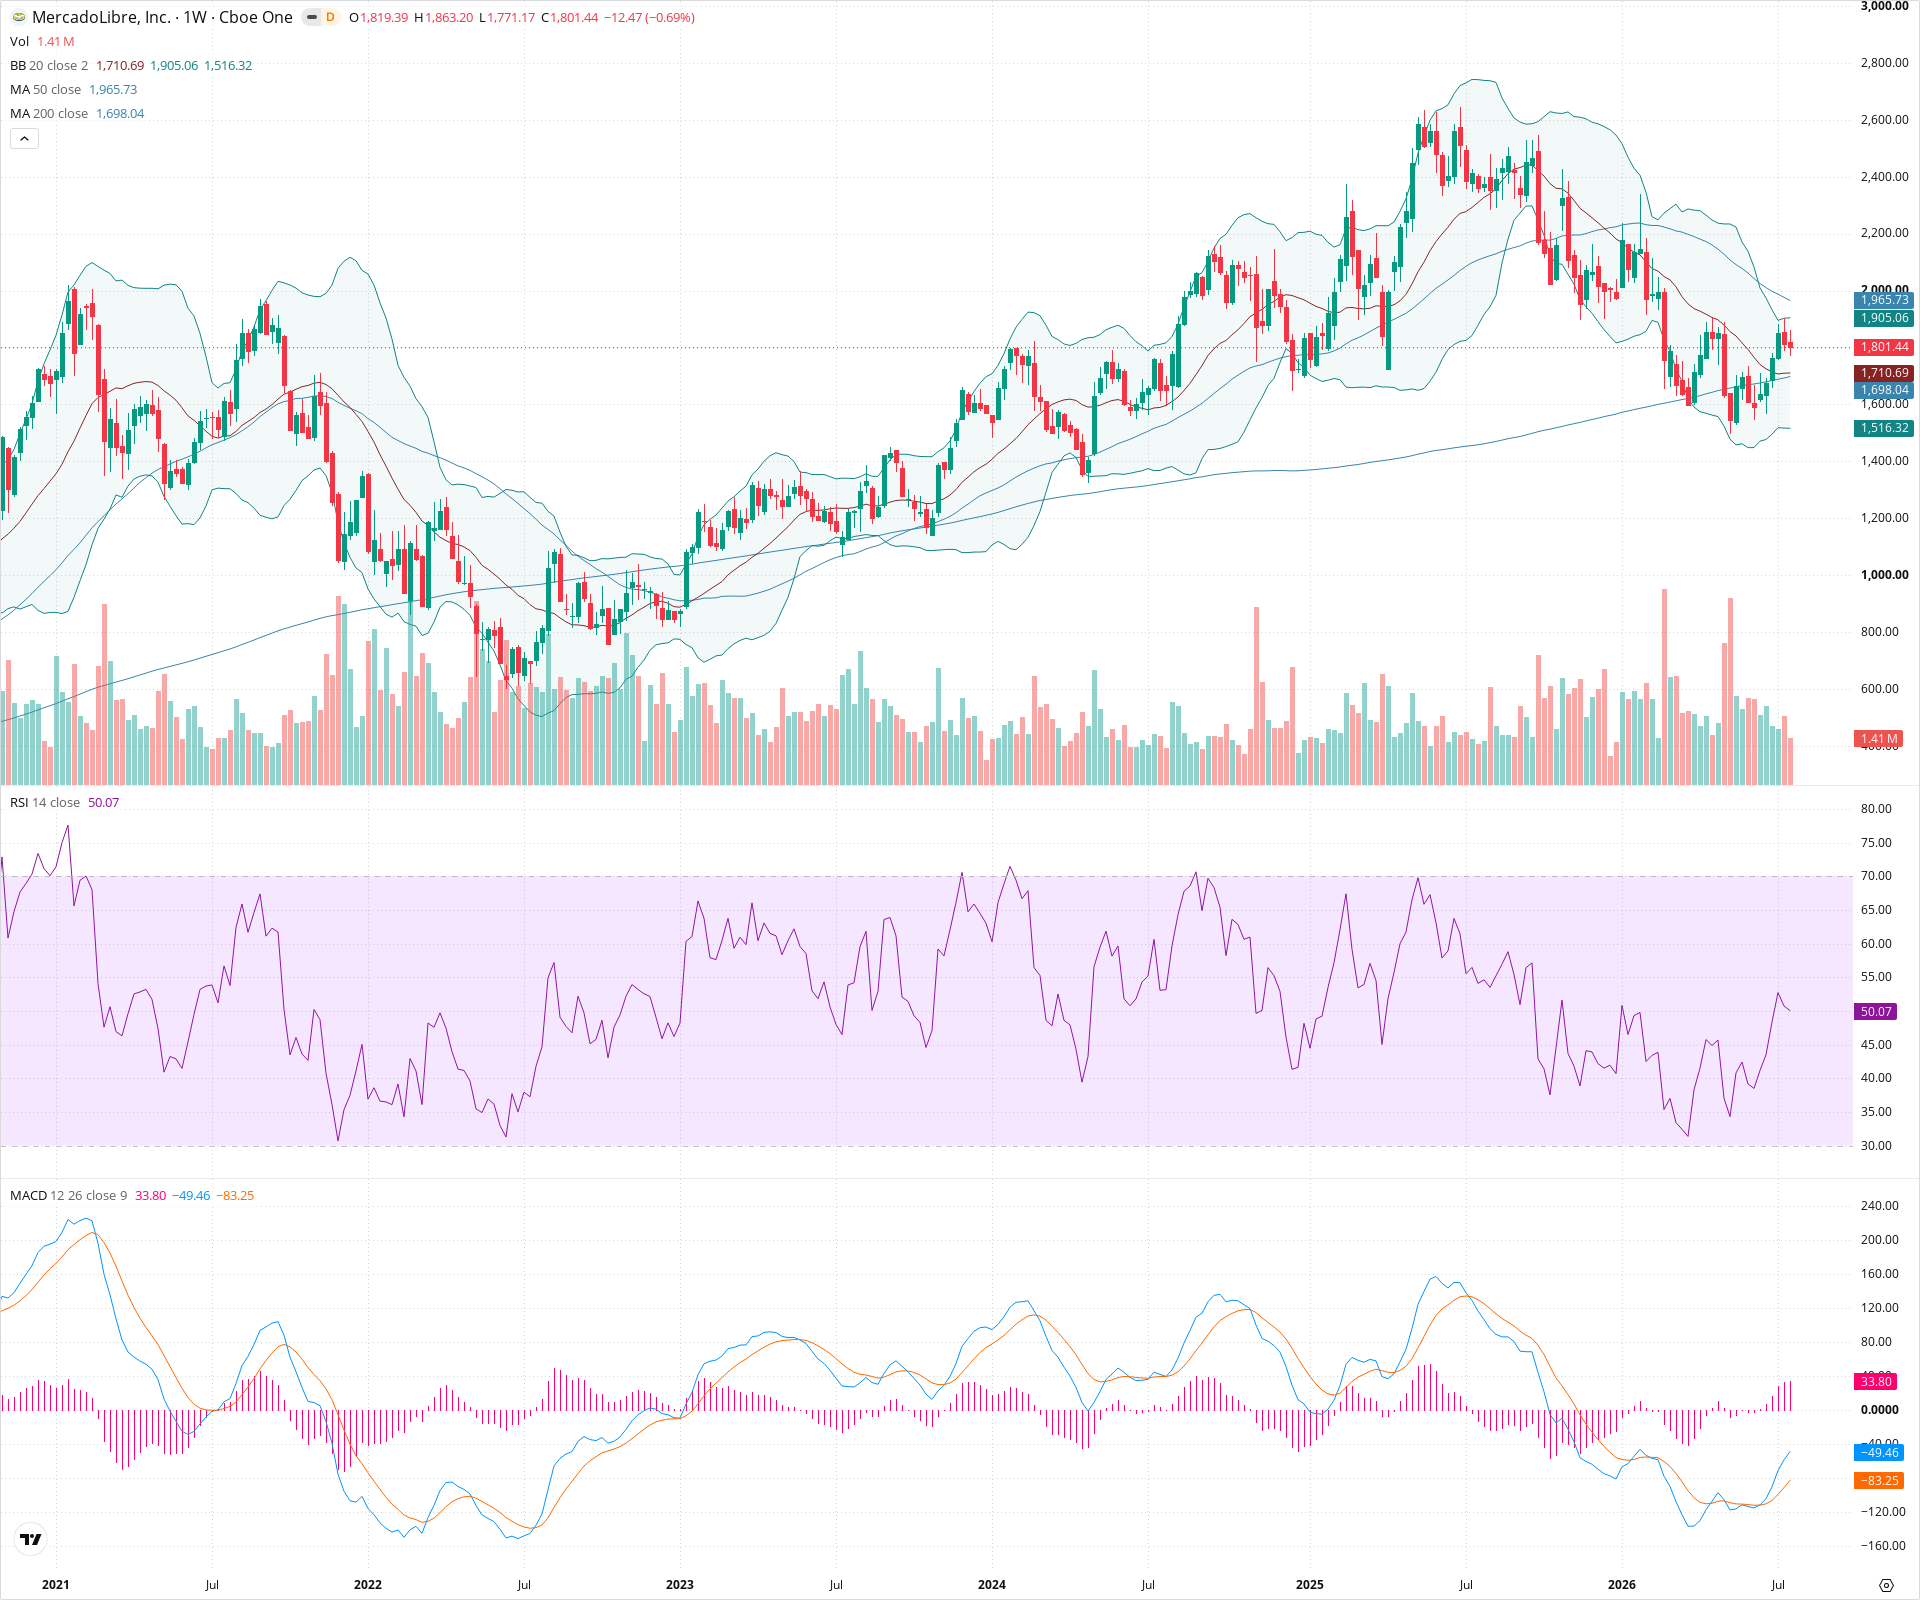
MELI remains in a long-term uptrend, defined by rising 50- and 200-week SMAs. After a period of multi-week consolidation and pullback, price has found strong support at the 50-week SMA and is attempting to reverse higher. Short-term momentum is improving, while long-term structure remains firmly bullish.
Included In Lists
Related Tickers of Interest
MELI Weekly Chart
Sentiment
Short-term Sentiment (days to weeks): Bullish
Price is rebounding strongly off the 50-week SMA, and RSI is pushing back up toward the 50 centerline, indicating renewed bullish momentum.
Long-term Sentiment (weeks to months): Bullish
The long-term trend remains up, with price comfortably above the 200-week SMA and the 50-week SMA sloping upwards, demonstrating structural strength.
Report Metadata
- Timeframe: weekly
- Generated at: 2026-07-25T09:05:46.698Z
- Model: gemini-3.1-pro-preview
Support Price Levels
| Level | Range | Strength | Notes |
|---|---|---|---|
| $1,705.00 | $1,690.00 - $1,720.00 | Strong | Confluence of recent swing low, the 50-week SMA, and the lower Bollinger Band. |
| $1,510.00 | $1,500.00 - $1,520.00 | Weak | Prior consolidation zone and swing low area. |
Resistance Price Levels
| Level | Range | Strength | Notes |
|---|---|---|---|
| $1,910.00 | $1,900.00 - $1,920.00 | Weak | Upper boundary of the current consolidation structure and the 20-week SMA. |
| $2,450.00 | $2,400.00 - $2,500.00 | Strong | Major prior peak acting as long-term overhead resistance. |
Potential Chart Patterns in Formation
| Strength | Pattern | Signal | Target | Details |
|---|---|---|---|---|
| Weak | Bull Flag / Consolidation | Bullish | N/A | Price is consolidating after a significant uptrend, forming a potential continuation pattern. |
Frequently Asked Questions about MELI
What is the current sentiment for MELI?
The short-term sentiment for MELI is currently Bullish because Price is rebounding strongly off the 50-week SMA, and RSI is pushing back up toward the 50 centerline, indicating renewed bullish momentum.. The long-term trend is classified as Bullish.
What are the key support levels for MELI?
StockDips.AI has identified key support levels for MELI at $1,705.00 and $1,510.00. These levels may represent potential accumulation zones where buying interest could emerge.
Is MELI in a significant dip or a Value Dip right now?
MELI has a Value Score of 47/100. It is not currently flagged as a significant dip in the Top Dips list. It is not listed as a Value Dip because the long-term sentiment or value-score threshold does not qualify.
View the full interactive analysis on StockDips.AI.