LNG Daily Technical Analysis
Cheniere Energy, Inc.
Leading U.S. LNG exporter operating major liquefaction facilities supplying natural gas to Europe and Asia.
LNG Technical Analysis Summary
LNG is currently in a robust, well-established long-term uptrend, supported by a textbook bullish moving average alignment. In the short term, the stock is digesting a recent strong run, resulting in a minor pullback as momentum indicators like RSI and MACD cool off from elevated levels. The primary trend remains heavily favored to the upside, with current price action appearing to be a standard consolidation phase before potential continuation.
Included In Lists
Related Tickers of Interest
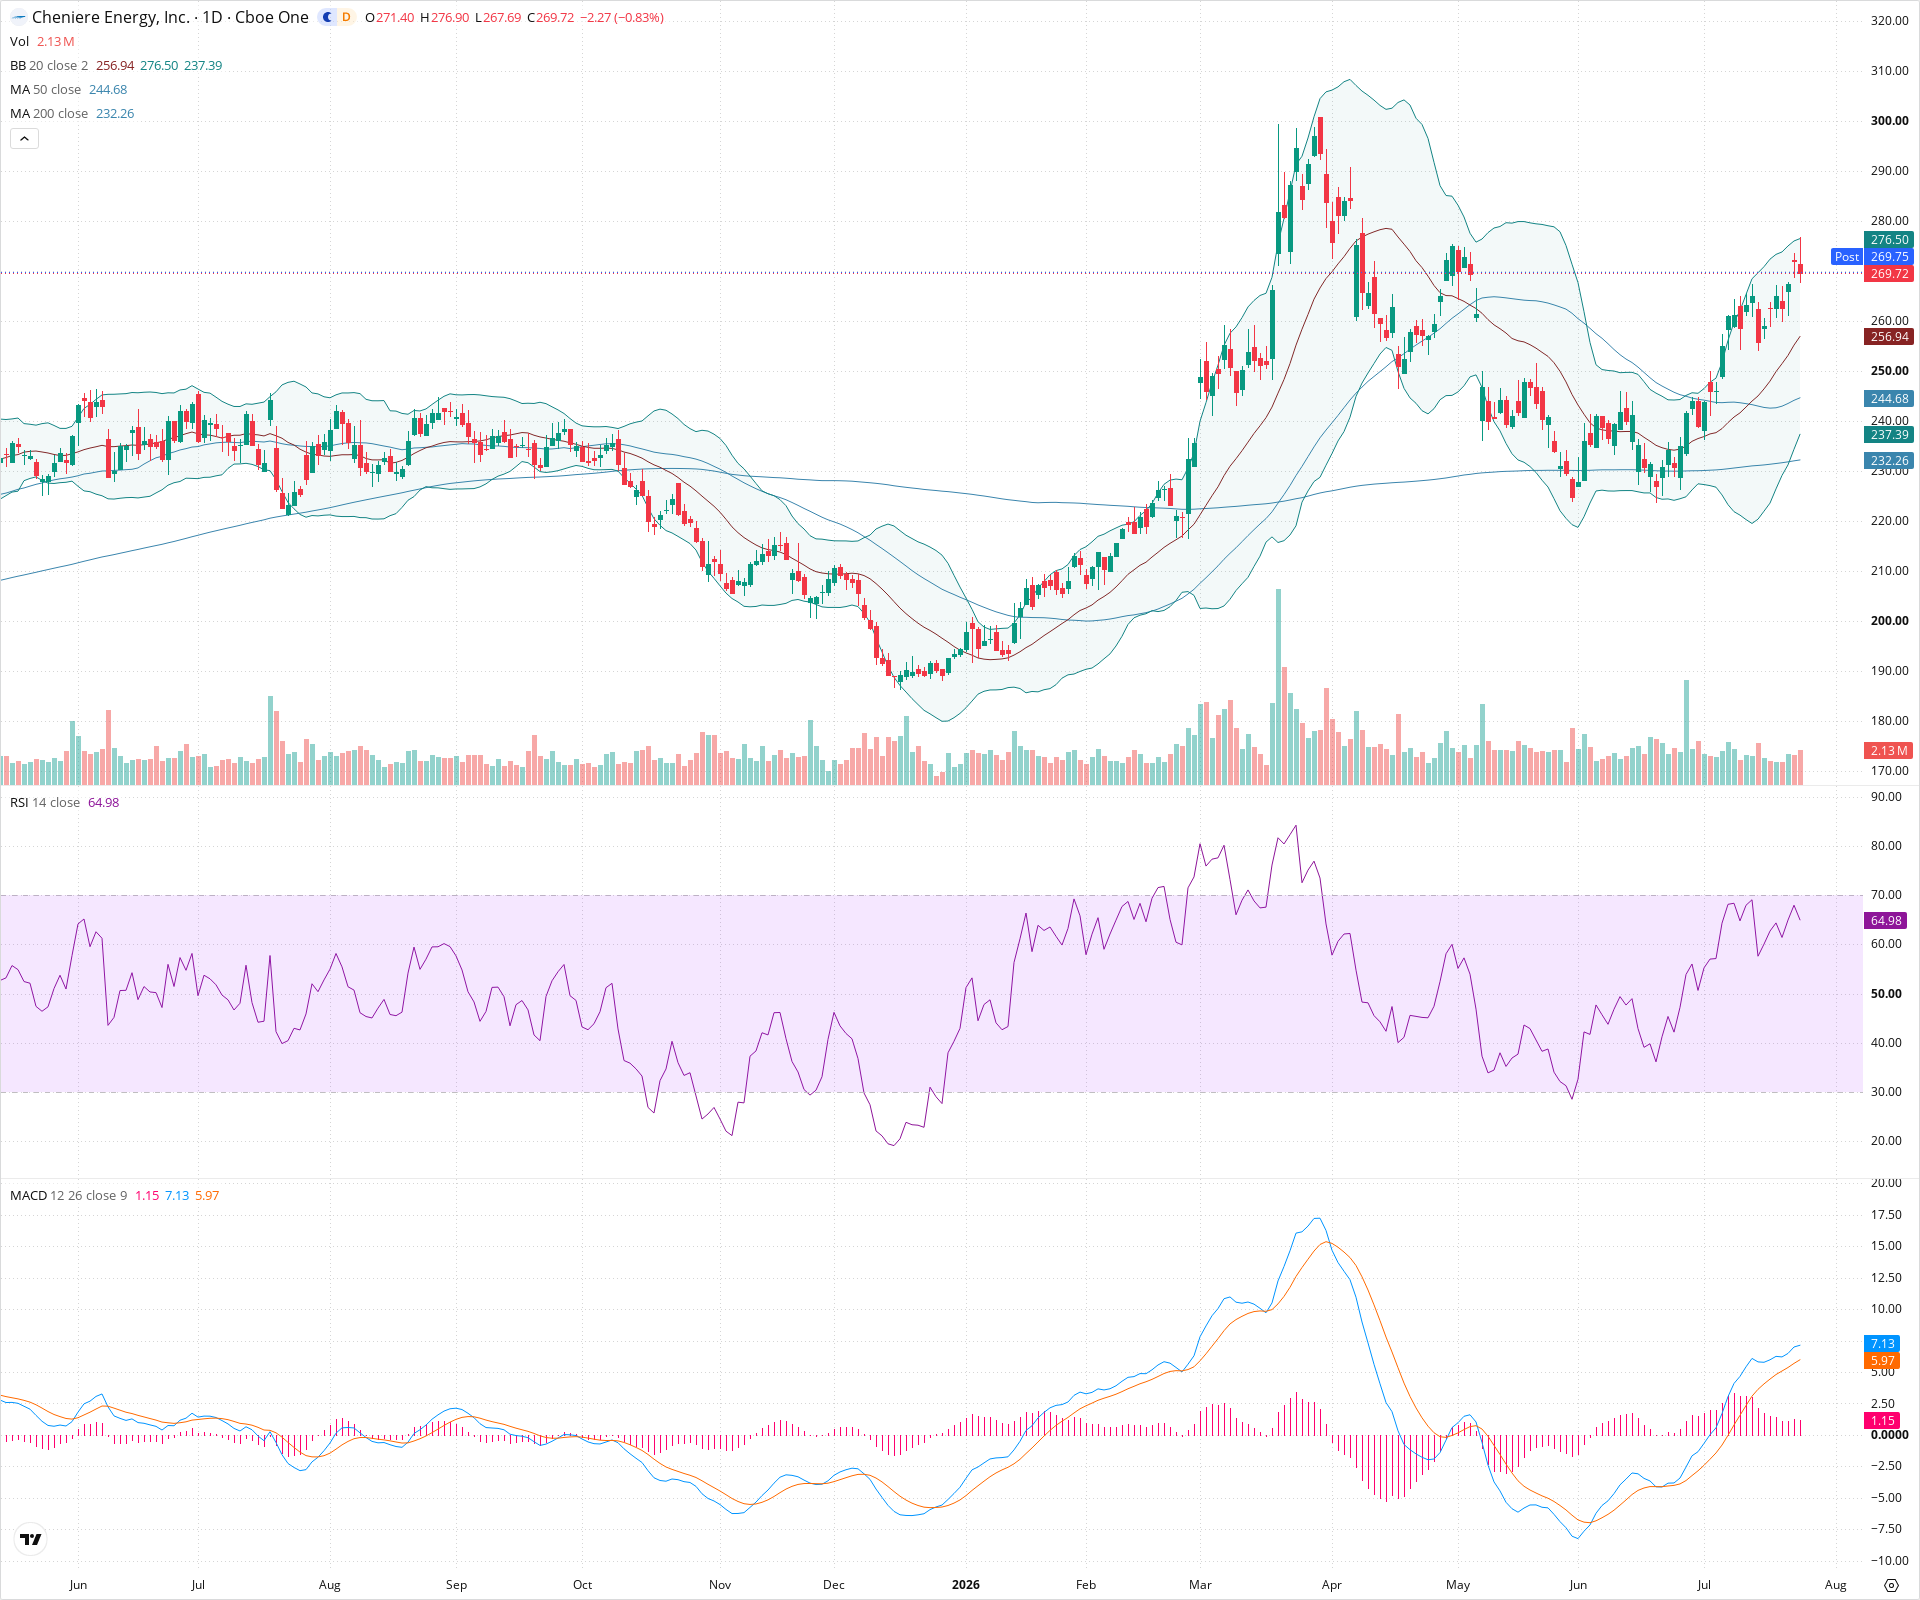
LNG Daily Chart
Sentiment
Short-term Sentiment (days to weeks): Neutral
Price is currently experiencing a short-term pullback after setting a new local high and piercing the upper Bollinger Band. Momentum indicators reflect this cooling off, with RSI turning down from near overbought levels and the MACD histogram showing contracting positive momentum.
Long-term Sentiment (weeks to months): Bullish
The broader chart structure shows a clearly defined uptrend with a sequence of higher highs and higher lows since the major bottom. Furthermore, the 20, 50, and 200-day SMAs are all sloping upward in a strong bullish alignment.
Report Metadata
- Timeframe: daily
- Generated at: 2026-07-24T21:08:32.798Z
- Model: gemini-3.1-pro-preview
Support Price Levels
| Level | Range | Strength | Notes |
|---|---|---|---|
| $257.50 | $255.00 - $260.00 | Weak | Immediate support zone near the rising 20-day SMA and a recent brief consolidation area. |
| $242.50 | $240.00 - $245.00 | Strong | Significant structural support level aligning with the 50-day SMA and a prominent prior swing low that launched the current leg up. |
| $232.50 | $230.00 - $235.00 | Strong | Long-term support zone resting on the 200-day SMA and previous major price congestion. |
Resistance Price Levels
| Level | Range | Strength | Notes |
|---|---|---|---|
| $276.75 | $276.00 - $277.50 | Strong | The immediate overhead resistance established by the most recent swing high before the current pullback. |
| $300.00 | $295.00 - $305.00 | Strong | Major historical peak visible earlier in the chart, representing significant long-term overhead supply. |
Potential Chart Patterns in Formation
| Strength | Pattern | Signal | Target | Details |
|---|---|---|---|---|
| Strong | Uptrend Channel | Bullish | N/A | Price action has been consistently forming higher highs and higher lows over an extended period, riding above upward-sloping moving averages. |
Frequently Asked Questions about LNG
What is the current sentiment for LNG?
The short-term sentiment for LNG is currently Neutral because Price is currently experiencing a short-term pullback after setting a new local high and piercing the upper Bollinger Band. Momentum indicators reflect this cooling off, with RSI turning down from near overbought levels and the MACD histogram showing contracting positive momentum.. The long-term trend is classified as Bullish.
What are the key support levels for LNG?
StockDips.AI has identified key support levels for LNG at $257.50 and $242.50. These levels may represent potential accumulation zones where buying interest could emerge.
Is LNG in a significant dip or a Value Dip right now?
LNG has a Value Score of 37/100. It is not currently flagged as a significant dip in the Top Dips list. It is not listed as a Value Dip because the long-term sentiment or value-score threshold does not qualify.
View the full interactive analysis on StockDips.AI.