MELI Monthly Technical Analysis
MercadoLibre Inc
Latin America's leading e-commerce and digital payments company.
MELI Technical Analysis Summary
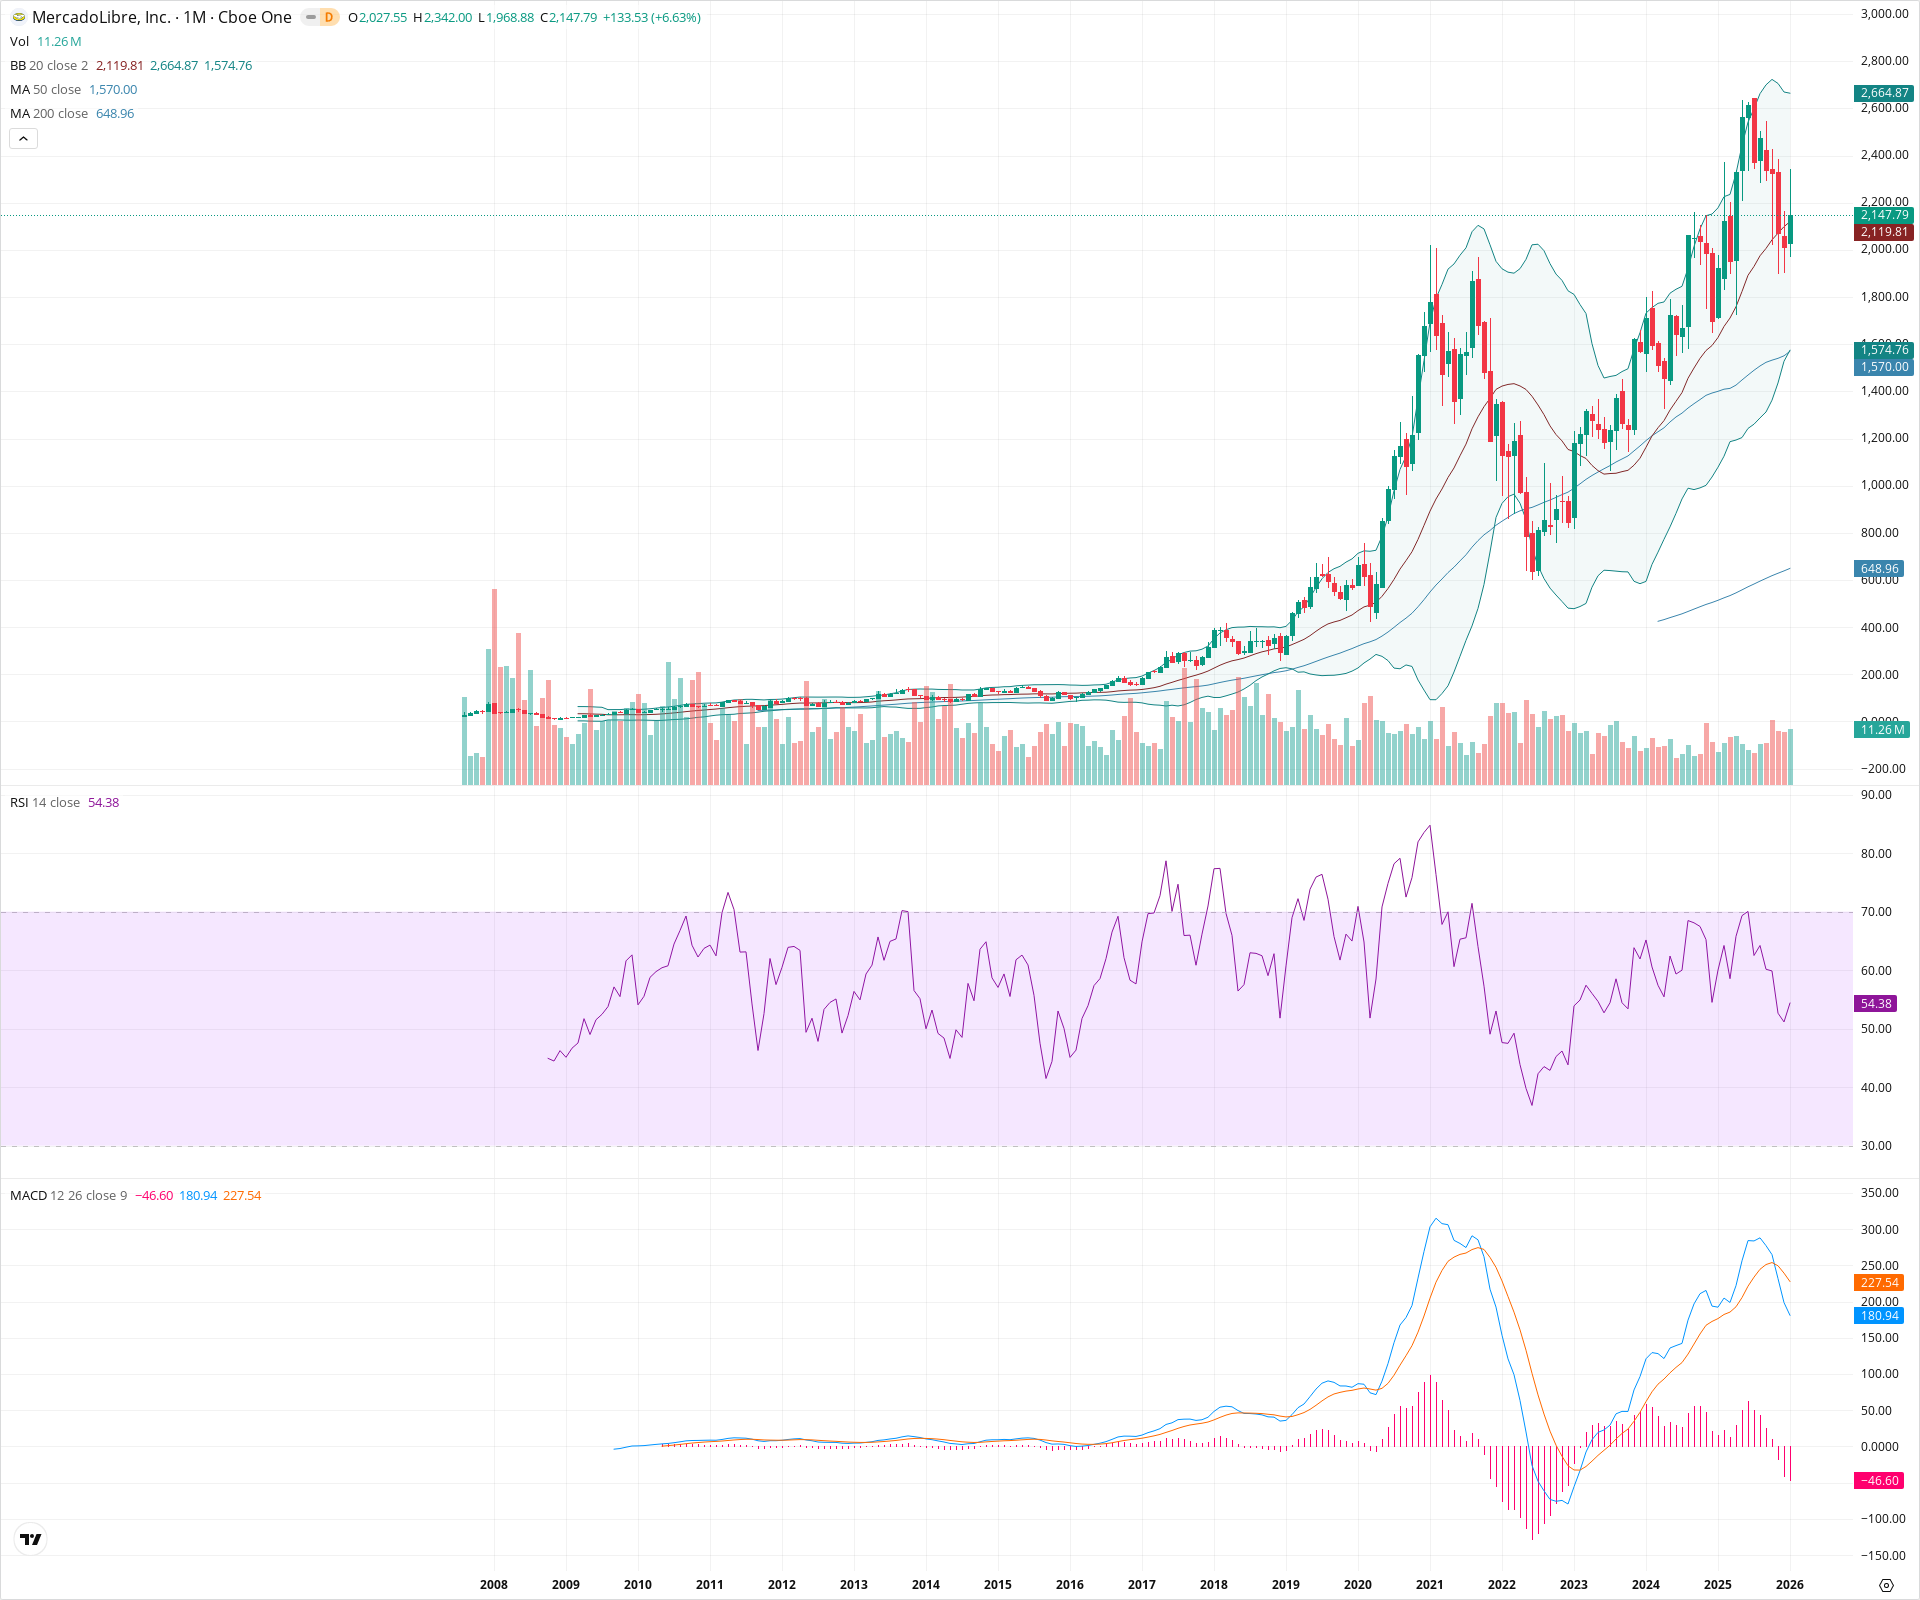
MercadoLibre remains in a dominant long-term uptrend, having completed a full recovery from its 2022 lows to challenge historical highs. The stock is currently testing and holding the 20-month SMA support zone, a critical level for trend continuation. Although the monthly MACD indicates some loss of momentum with a bearish crossover, the price structure is robust, and the alignment of moving averages supports a continued bullish outlook for long-term investors.
Included In Lists
Related Tickers of Interest
MELI Monthly Chart
Sentiment
Short-term Sentiment (days to weeks): Bullish
The price is actively defending the 20-month SMA (approx. 2,119) with a strong green candle this month (+6.63%), bouncing from recent lows. While momentum is cooling, price action remains constructive above this key dynamic support.
Long-term Sentiment (weeks to months): Bullish
The chart shows a confirmed secular bull regime with price recovering to new all-time highs after the 2022 bear cycle. Moving averages are in perfect bullish alignment (20 > 50 > 200) and expanding.
Report Metadata
- Timeframe: monthly
- Generated at: 2026-02-02T06:45:31.417Z
- Model: gemini-3-pro-preview
Support Price Levels
| Level | Range | Strength | Notes |
|---|---|---|---|
| $1,984.00 | $1,968.00 - $2,000.00 | Strong | Current month's low and the major psychological level corresponding to the 2021 secular peak. |
| $1,572.50 | $1,570.00 - $1,575.00 | Strong | Confluence of the 50-month SMA and the Lower Bollinger Band. |
| $649.00 | $648.00 - $650.00 | Weak | Far-off structural support at the 200-month SMA. |
Resistance Price Levels
| Level | Range | Strength | Notes |
|---|---|---|---|
| $2,371.00 | $2,342.00 - $2,400.00 | Strong | The immediate overhead resistance defined by the recent all-time high wicks. |
| $2,664.50 | $2,664.00 - $2,665.00 | Weak | The projected Upper Bollinger Band level. |
Potential Chart Patterns in Formation
| Strength | Pattern | Signal | Target | Details |
|---|---|---|---|---|
| Strong | Cup and Handle / Rounding Bottom | Bullish | N/A | A massive multi-year recovery structure spanning from the 2021 high, down to the 2022 low, and back to highs in 2024. The recent consolidation may represent the 'handle' or a high-level base. |
Frequently Asked Questions about MELI
What is the current sentiment for MELI?
The short-term sentiment for MELI is currently Bullish because The price is actively defending the 20-month SMA (approx. 2,119) with a strong green candle this month (+6.63%), bouncing from recent lows. While momentum is cooling, price action remains constructive above this key dynamic support.. The long-term trend is classified as Bullish.
What are the key support levels for MELI?
StockDips.AI has identified key support levels for MELI at $1,984.00 and $1,572.50. These levels may represent potential accumulation zones where buying interest could emerge.
Is MELI in a significant dip or a Value Dip right now?
MELI has a Value Score of 47/100. It is not currently flagged as a significant dip in the Top Dips list. It is not listed as a Value Dip because the long-term sentiment or value-score threshold does not qualify.
View the full interactive analysis on StockDips.AI.