META Weekly Technical Analysis
Meta Platforms Inc
Owner of Facebook, Instagram, and WhatsApp with investment in AI and virtual reality.
META Technical Analysis Summary
META is currently undergoing a severe weekly correction, having sharply broken below its 50-week SMA with strong downside momentum confirmed by MACD and RSI. Short-term sentiment is solidly bearish as sellers control the tape and push price toward the lower Bollinger Band. Long-term investors should watch for potential stabilization in the $476-$520 zone, where the rising 200-week SMA may offer critical structural support to determine if the secular uptrend remains viable.
Included In Lists
Related Tickers of Interest
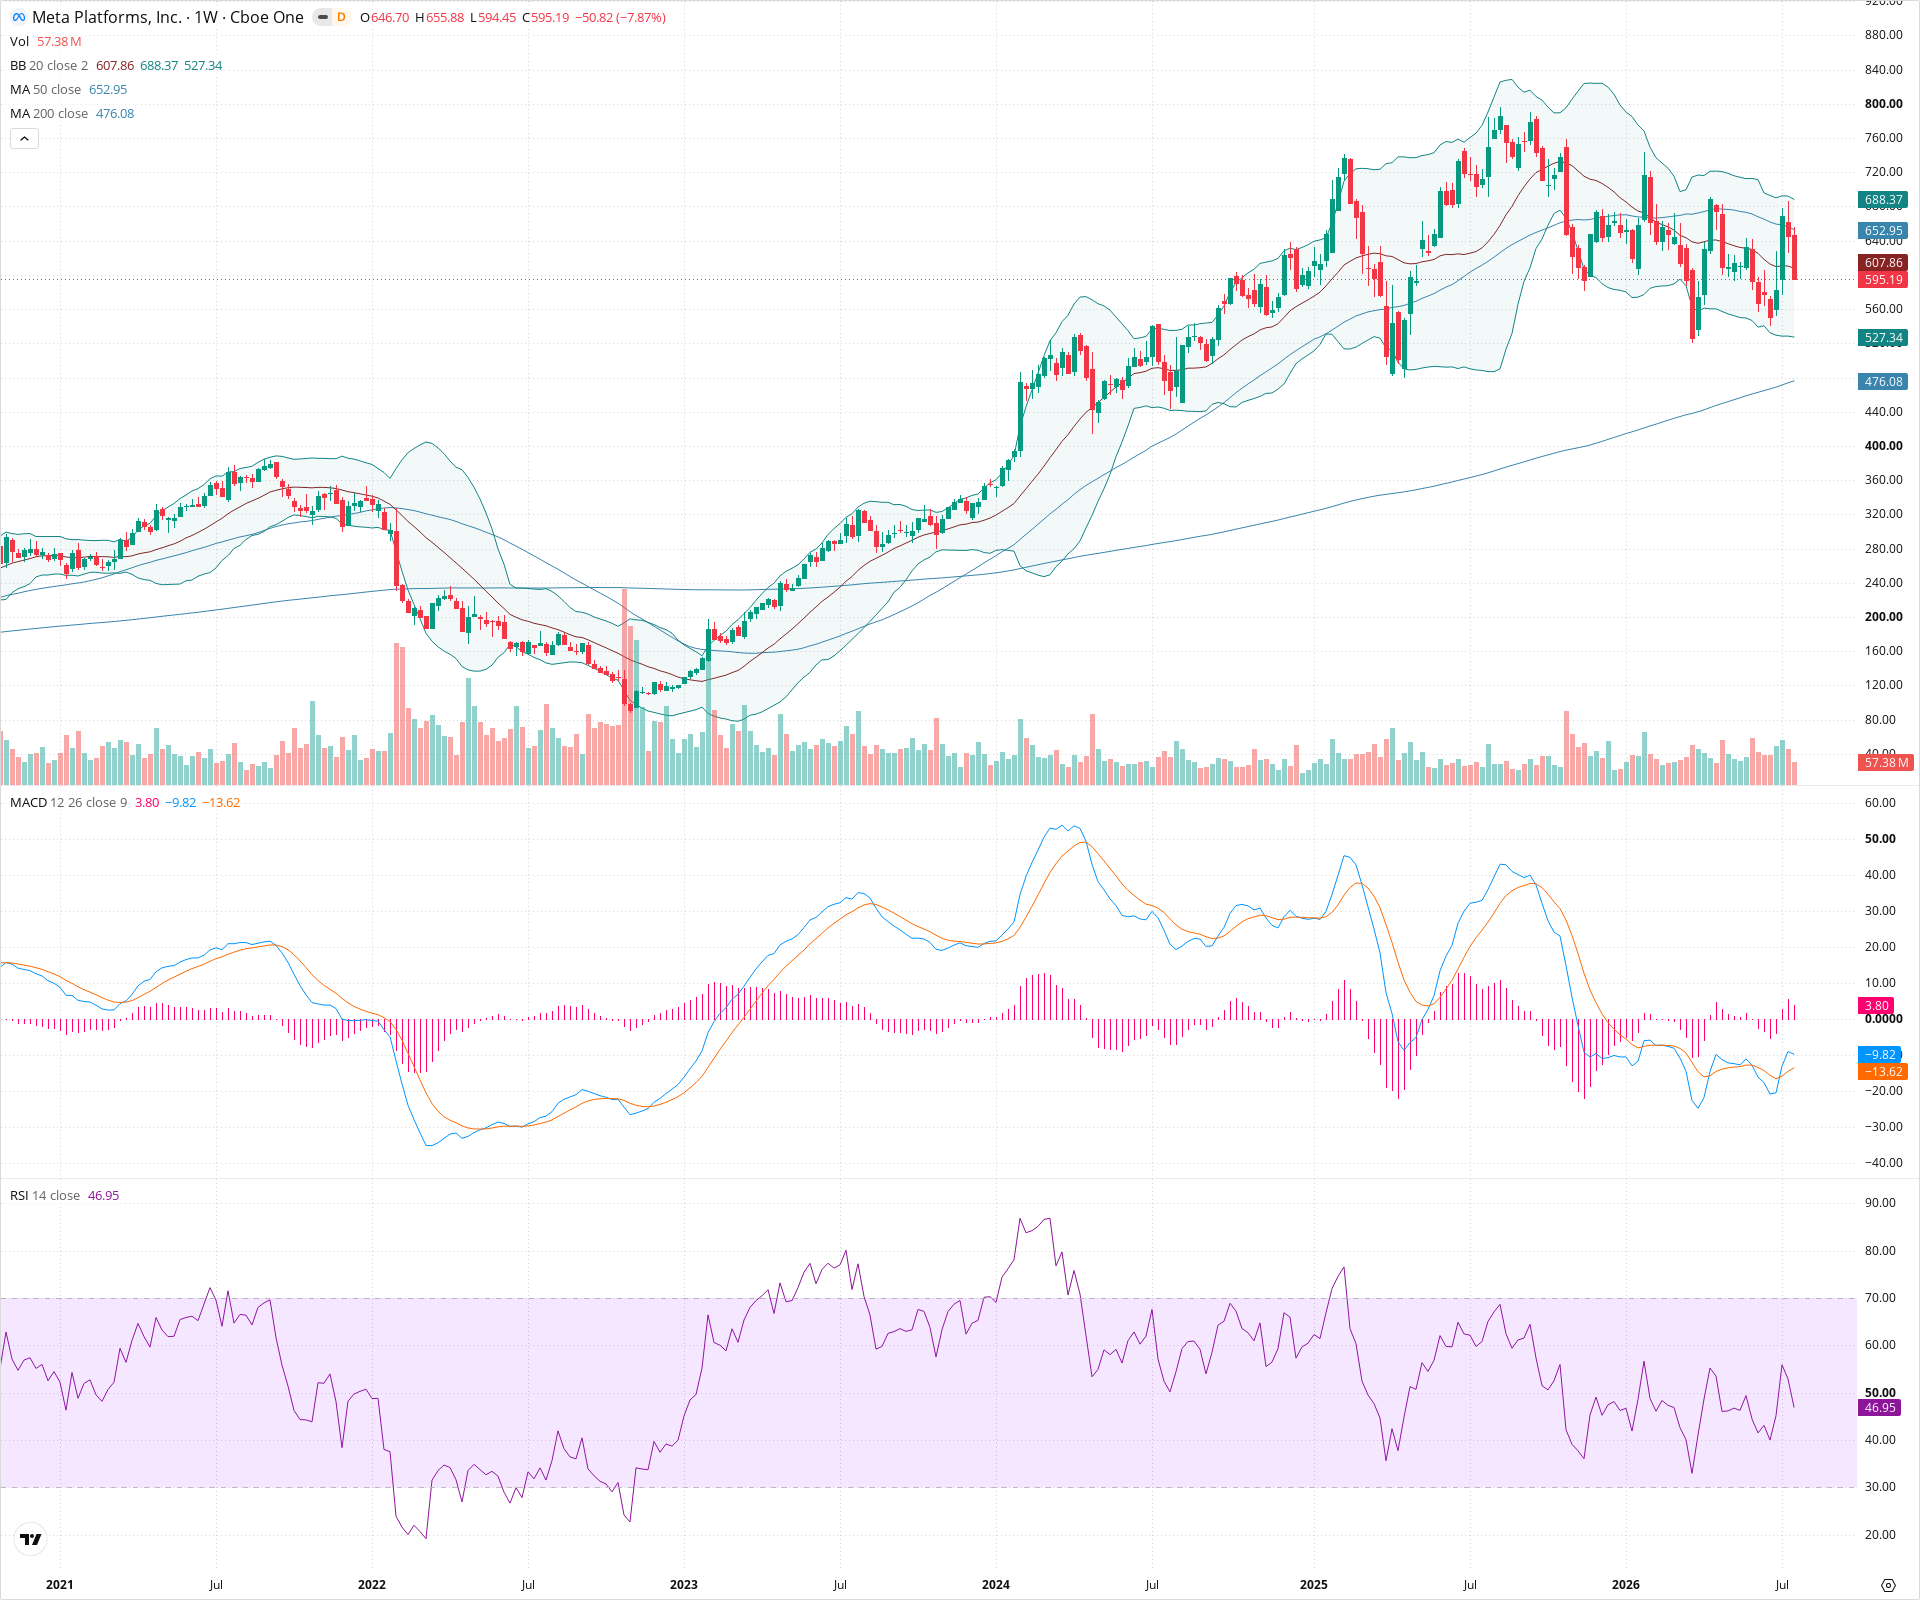
META Weekly Chart
Sentiment
Short-term Sentiment (days to weeks): Bearish
Price has broken below the 50-week SMA and is printing large red candles on elevated volume, confirmed by an expanding negative MACD histogram and RSI dropping below 50.
Long-term Sentiment (weeks to months): Neutral
While the broader uptrend from the 2022 lows remains intact with price above the rising 200-week SMA, the severity of the current pullback and loss of the 50-week SMA suggests a significant intermediate-term correction is underway.
Report Metadata
- Timeframe: weekly
- Generated at: 2026-07-25T09:02:16.999Z
- Model: gemini-3.1-pro-preview
Support Price Levels
| Level | Range | Strength | Notes |
|---|---|---|---|
| $498.00 | $476.00 - $520.00 | Strong | Zone encompassing the rising 200-week SMA (currently at 476) and previous consolidation areas from mid-2024. |
| $400.00 | $380.00 - $420.00 | Strong | Major structural breakout zone and consolidation base from late 2023. |
Resistance Price Levels
| Level | Range | Strength | Notes |
|---|---|---|---|
| $650.00 | $640.00 - $660.00 | Strong | Recent breakdown level, previous support, and current location of the 50-week SMA. |
| $730.00 | $720.00 - $740.00 | Weak | Recent lower high formed before the steep sell-off. |
| $780.00 | $760.00 - $800.00 | Strong | All-time high zone and major psychological resistance. |
Potential Chart Patterns in Formation
| Strength | Pattern | Signal | Target | Details |
|---|---|---|---|---|
| Strong | Trend Support Breakdown | Bearish | N/A | After a massive multi-year run, price formed a lower high and has decisively broken below its key intermediate-term trendline (50-week SMA) on accelerating bearish momentum. |
Frequently Asked Questions about META
What is the current sentiment for META?
The short-term sentiment for META is currently Bearish because Price has broken below the 50-week SMA and is printing large red candles on elevated volume, confirmed by an expanding negative MACD histogram and RSI dropping below 50.. The long-term trend is classified as Neutral.
What are the key support levels for META?
StockDips.AI has identified key support levels for META at $498.00 and $400.00. These levels may represent potential accumulation zones where buying interest could emerge.
Is META in a significant dip or a Value Dip right now?
META has a Value Score of 30/100. It is not currently flagged as a significant dip in the Top Dips list. It is not listed as a Value Dip because the long-term sentiment or value-score threshold does not qualify.
View the full interactive analysis on StockDips.AI.