META Monthly Technical Analysis
Meta Platforms Inc
Owner of Facebook, Instagram, and WhatsApp with investment in AI and virtual reality.
META Technical Analysis Summary
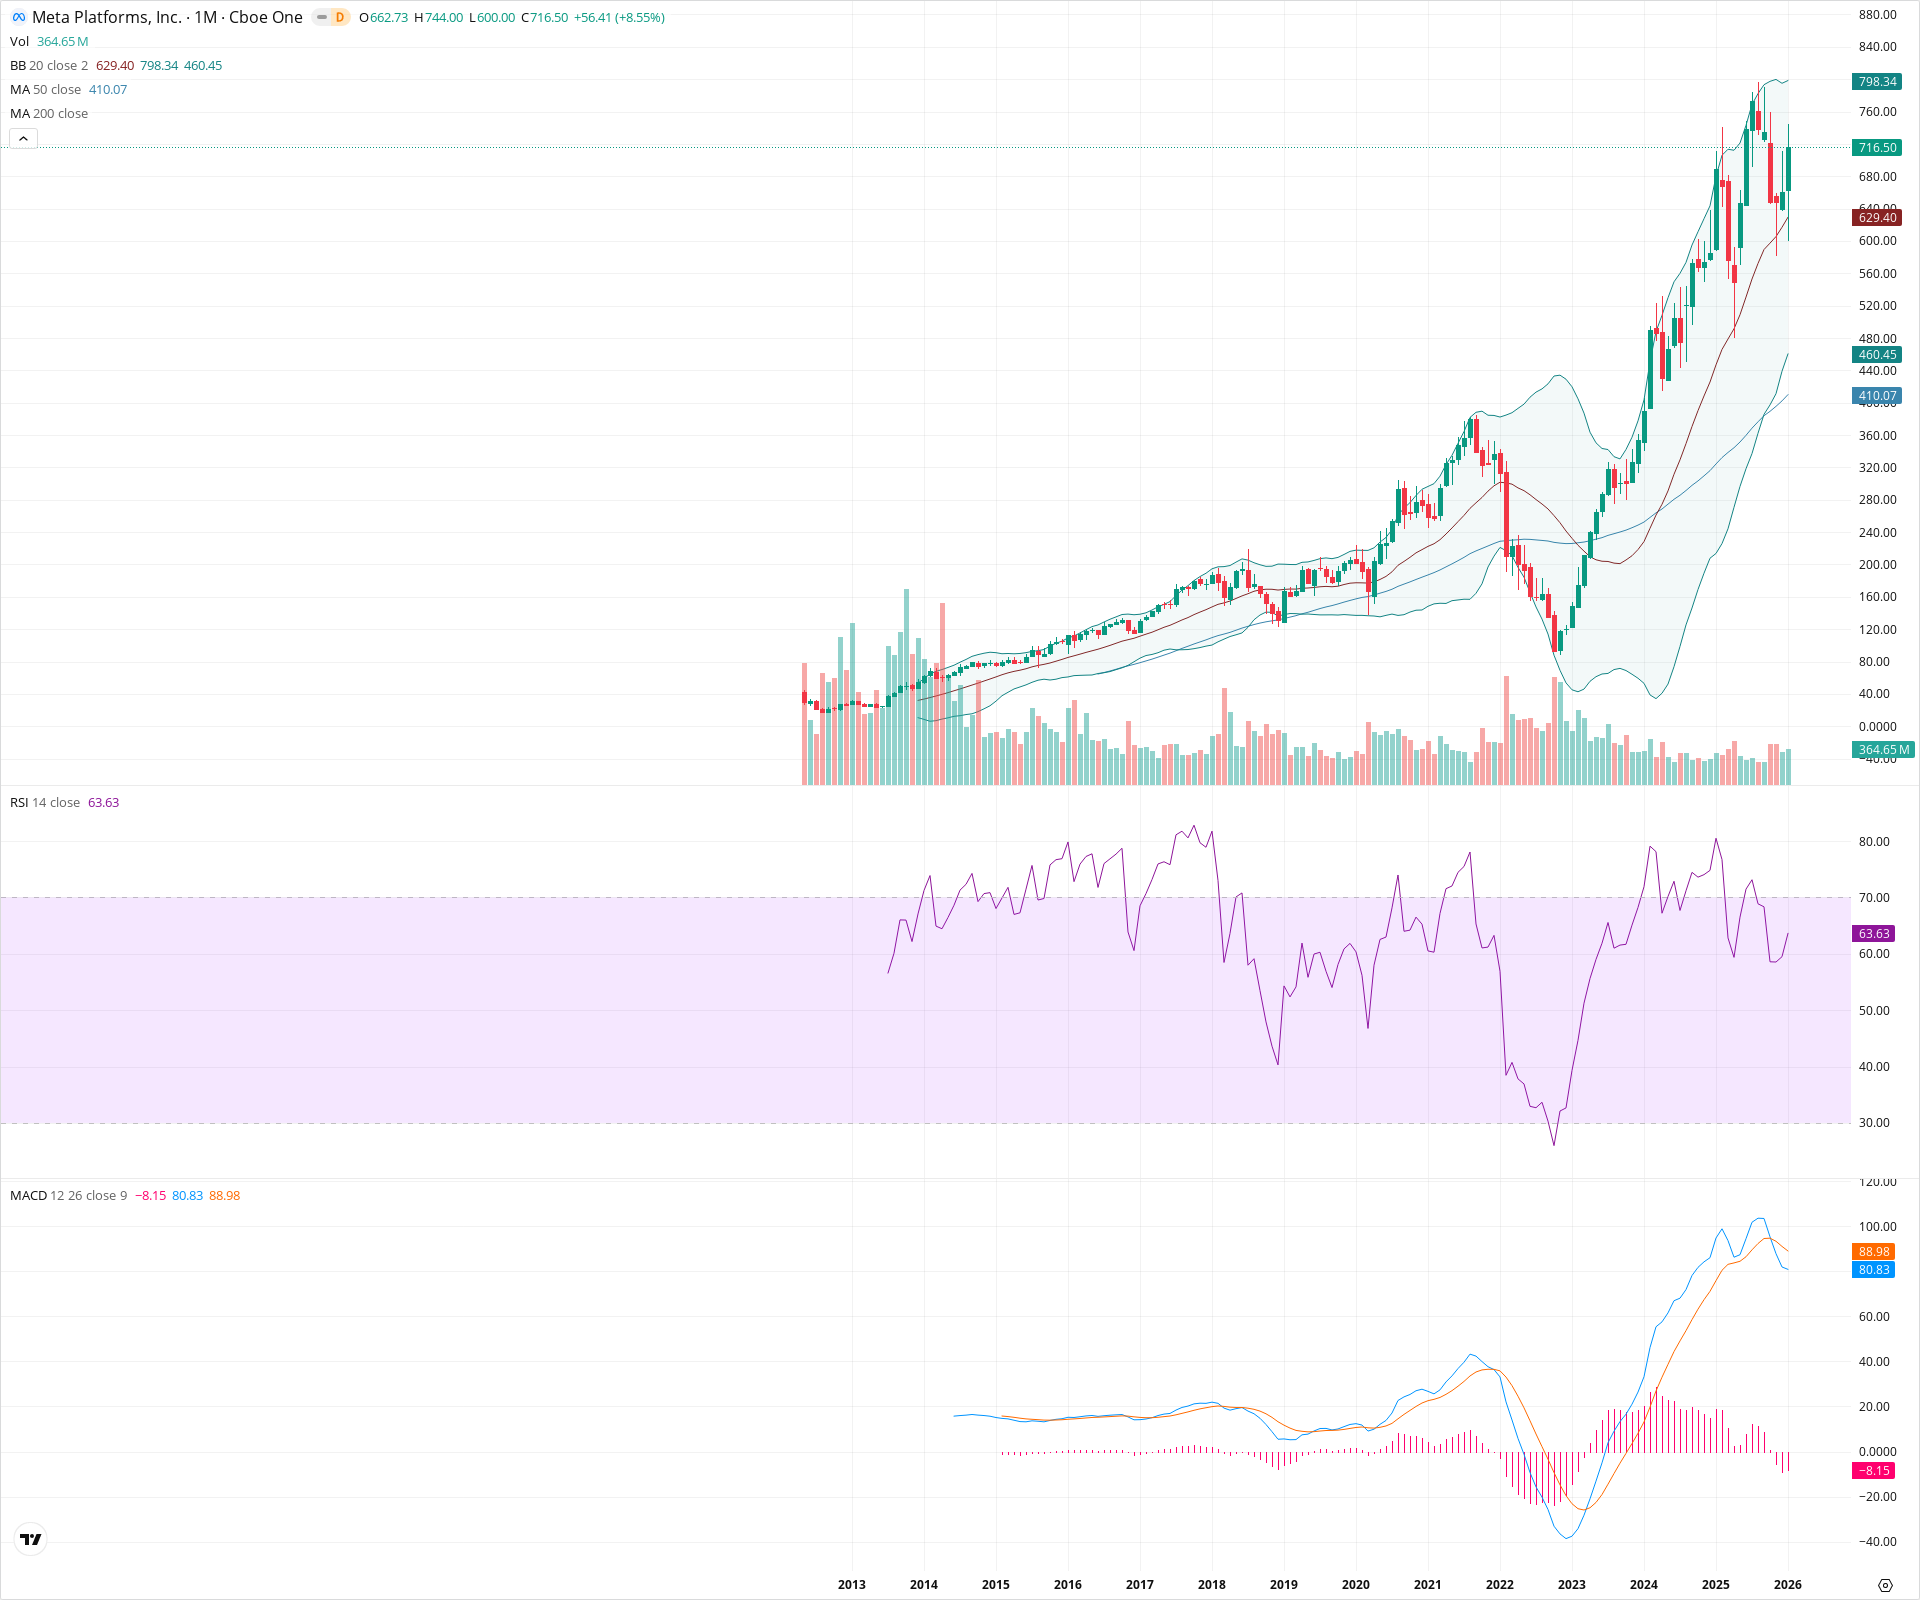
Meta Platforms is exhibiting exceptional long-term strength, trading in a 'blue sky' breakout regime significantly above its major moving averages. While the monthly MACD shows a technical bearish crossover (momentum divergence) suggesting the rate of ascent may eventually slow, the price action remains dominant with no signs of reversal. The stock is currently riding the upper Bollinger Band, a hallmark of a strong volatility breakout, with major support established well below at the previous 2021 highs.
Included In Lists
Related Tickers of Interest
META Monthly Chart
Sentiment
Short-term Sentiment (days to weeks): Bullish
The current monthly candle is extremely strong (+8.55%), pushing to new all-time highs and trading near the top of its range, indicating aggressive buying pressure.
Long-term Sentiment (weeks to months): Bullish
The stock is in a confirmed secular uptrend, well above rising 20 and 50-month SMAs, having successfully completed a V-shaped recovery and entered price discovery.
Report Metadata
- Timeframe: monthly
- Generated at: 2026-02-02T06:45:54.865Z
- Model: gemini-3-pro-preview
Support Price Levels
| Level | Range | Strength | Notes |
|---|---|---|---|
| $540.00 | $530.00 - $550.00 | Strong | Recent consolidation floor prior to the current leg up. |
| $385.00 | $380.00 - $390.00 | Strong | Former multi-year all-time high from 2021; major structural polarity zone. |
| $290.00 | $280.00 - $300.00 | Weak | Intermediate support level from the mid-trend breakout area. |
Resistance Price Levels
| Level | Range | Strength | Notes |
|---|---|---|---|
| $744.00 | $744.00 - $744.00 | Weak | Current month's intraday high and immediate resistance. |
| $799.00 | $798.00 - $800.00 | Strong | Upper Bollinger Band level and major psychological round number. |
Potential Chart Patterns in Formation
| Strength | Pattern | Signal | Target | Details |
|---|---|---|---|---|
| Strong | V-Shaped Recovery / Parabolic Trend | Bullish | N/A | A sharp recovery from the 2022 lows leading directly into a powerful parabolic expansion into new highs. |
| Strong | Blue Sky Breakout | Bullish | $800.00 | Price is trading decisively above previous historical resistance levels, entering a zone of price discovery. |
Frequently Asked Questions about META
What is the current sentiment for META?
The short-term sentiment for META is currently Bullish because The current monthly candle is extremely strong (+8.55%), pushing to new all-time highs and trading near the top of its range, indicating aggressive buying pressure.. The long-term trend is classified as Bullish.
What are the key support levels for META?
StockDips.AI has identified key support levels for META at $540.00 and $385.00. These levels may represent potential accumulation zones where buying interest could emerge.
Is META in a significant dip or a Value Dip right now?
META has a Value Score of 30/100. It is not currently flagged as a significant dip in the Top Dips list. It is not listed as a Value Dip because the long-term sentiment or value-score threshold does not qualify.
View the full interactive analysis on StockDips.AI.