MU Weekly Technical Analysis
Micron Technology Inc
American producer of computer memory and data storage solutions, including DRAM (dynamic random-access memory) and NAND flash memory products. Their products are essential for a wide range of applications, from personal computers and mobile devices to data centers and automotive systems.
MU Technical Analysis Summary
MU is in a powerful, long-term parabolic uptrend. After reaching extreme overbought conditions, the stock underwent a severe but necessary multi-week correction, pulling back to test the 20-week moving average. The current price action shows a strong defense of this critical support level, suggesting the correction may be over and the primary bullish trend is preparing to resume. Long-term structure remains firmly bullish as long as price holds above major moving averages.
Included In Lists
Related Tickers of Interest
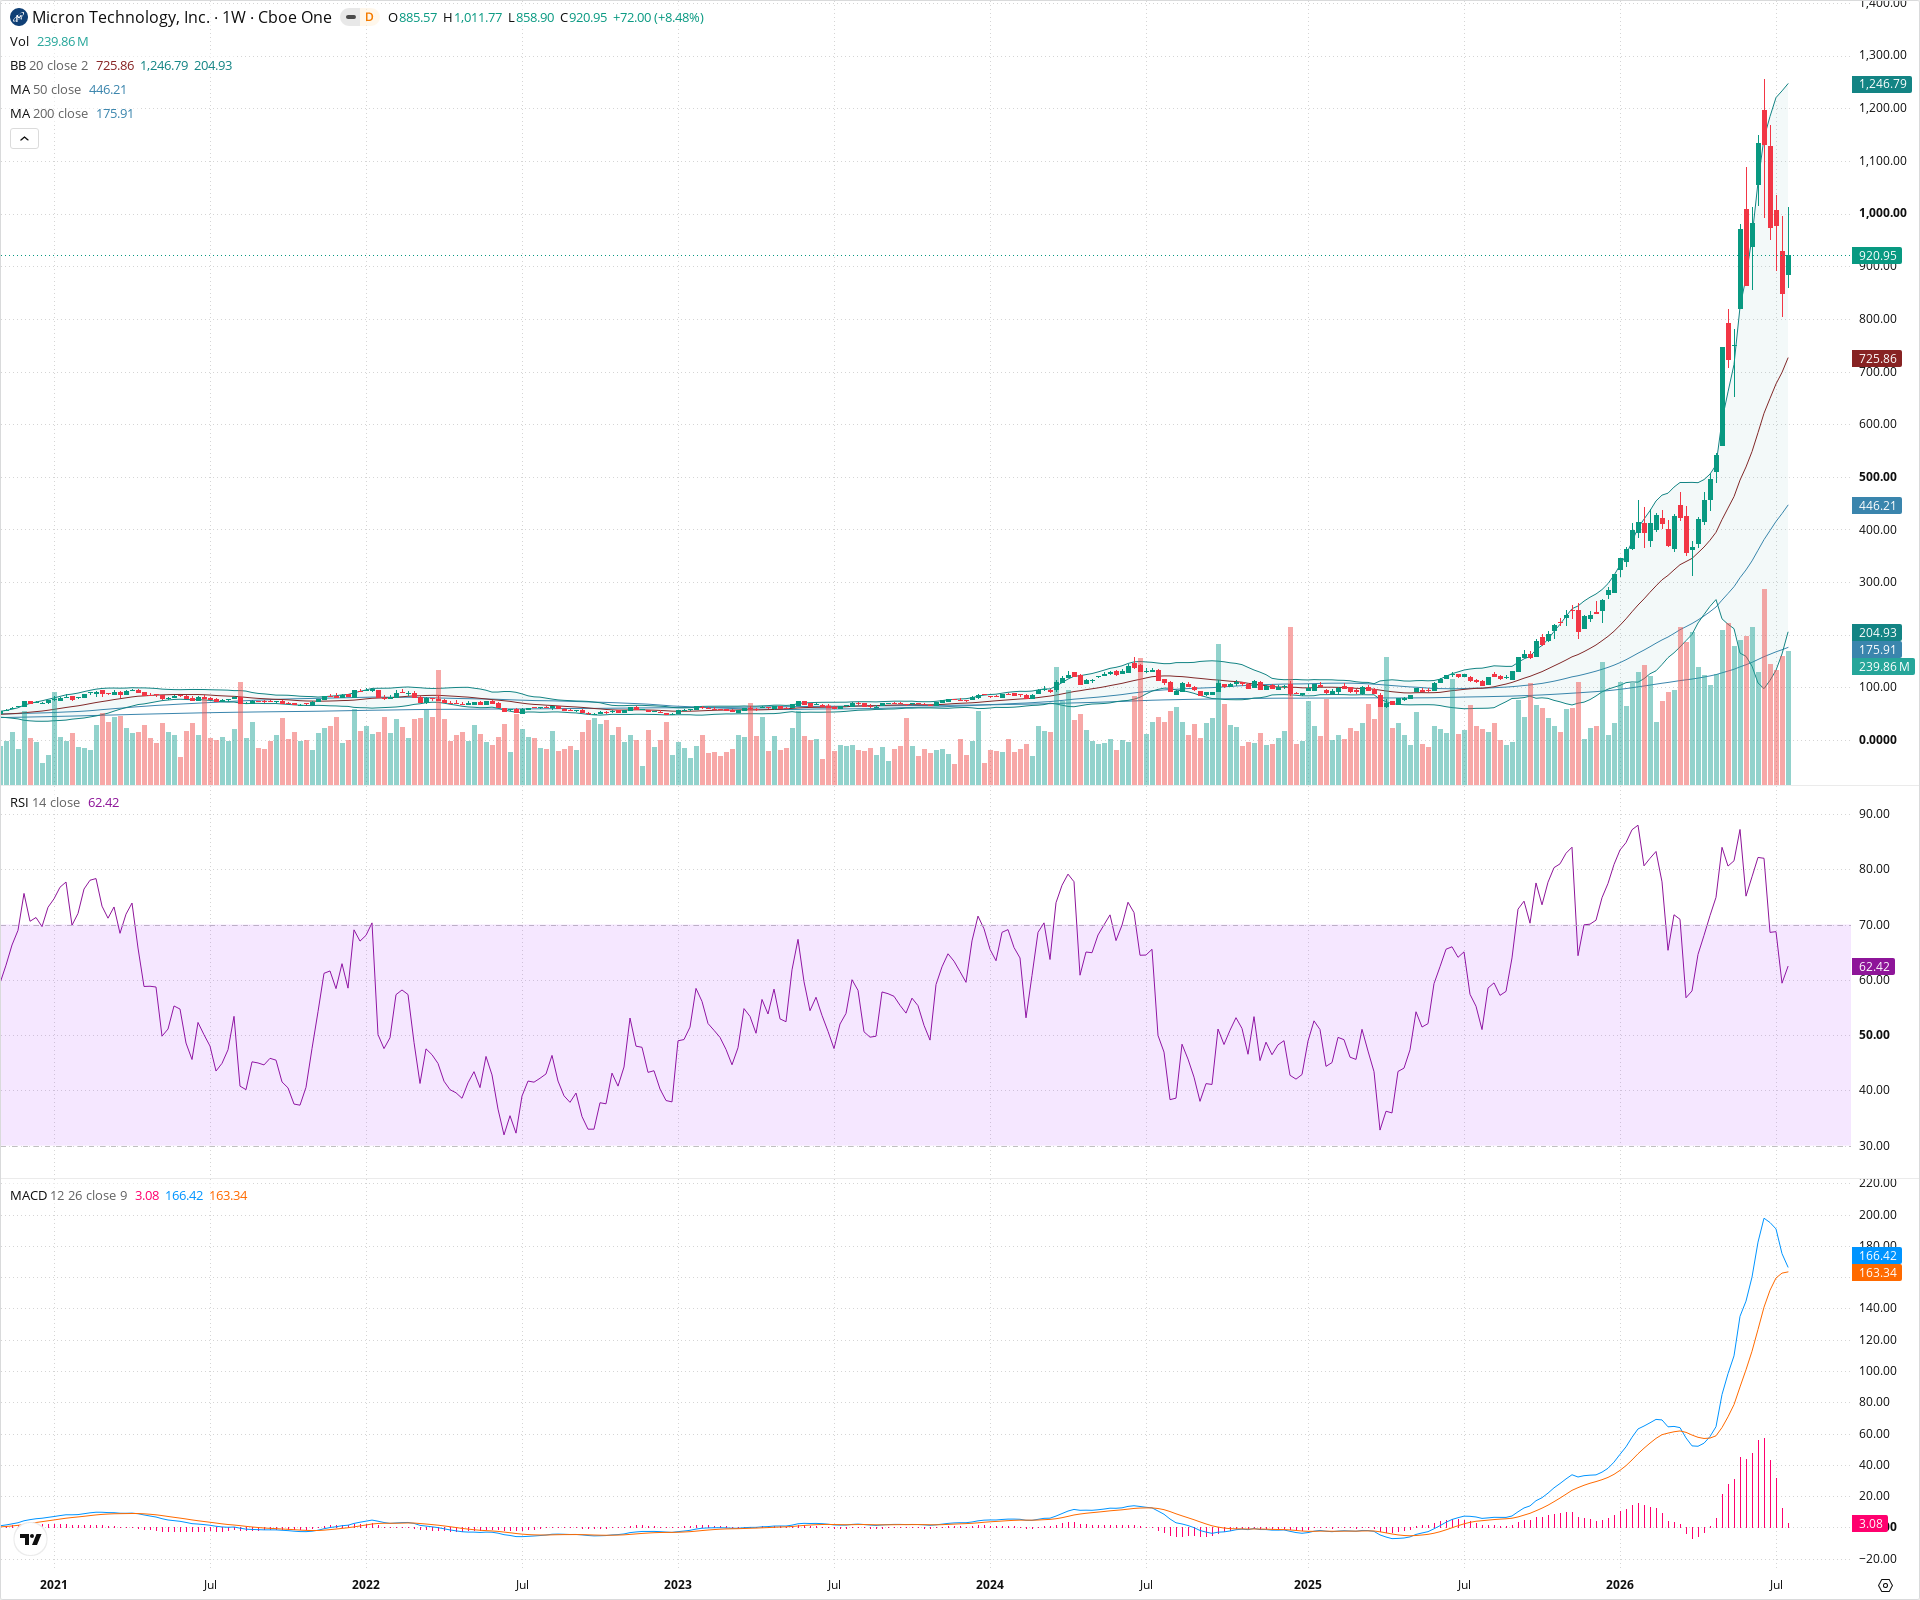
MU Weekly Chart
Sentiment
Short-term Sentiment (days to weeks): Bullish
Price experienced a sharp pullback but found strong support near the 20-week moving average (middle Bollinger Band). The current large green weekly candle indicates a strong bounce and potential resumption of the dominant uptrend. RSI is also curling back up from the neutral 50 zone.
Long-term Sentiment (weeks to months): Bullish
The chart displays a massive, parabolic multi-year uptrend. Price remains significantly above upward-sloping 50-week and 200-week SMAs. The recent correction appears to be a healthy consolidation within a larger macro bullish structure.
Report Metadata
- Timeframe: weekly
- Generated at: 2026-07-25T09:13:27.799Z
- Model: gemini-3.1-pro-preview
Support Price Levels
| Level | Range | Strength | Notes |
|---|---|---|---|
| $730.00 | $700.00 - $760.00 | Strong | Recent significant swing low area, converging with the 20-week SMA (middle Bollinger Band) which acted as dynamic support. |
| $475.00 | $450.00 - $500.00 | Weak | Prior consolidation zone before the steepest phase of the parabolic advance, aligning near the current level of the rising 50-week SMA. |
Resistance Price Levels
| Level | Range | Strength | Notes |
|---|---|---|---|
| $1,050.00 | $1,000.00 - $1,100.00 | Weak | Psychological resistance level and area of minor price stalling during the recent downtrend. |
| $1,300.00 | $1,250.00 - $1,350.00 | Strong | The recent all-time high area; major structural resistance that must be broken to continue the macro trend. |
Potential Chart Patterns in Formation
| Strength | Pattern | Signal | Target | Details |
|---|---|---|---|---|
| Strong | Bull Flag / Continuation Pattern | Bullish | N/A | The massive vertical run-up acts as a flagpole, followed by a sharp but controlled pullback to the 20-week SMA forming the flag. The current strong bullish candle suggests an attempted upside resolution and trend continuation. |
| Strong | Parabolic Advance | Bullish | N/A | A steeply accelerating uptrend characterized by widening Bollinger Bands and extreme distance from long-term moving averages. |
Frequently Asked Questions about MU
What is the current sentiment for MU?
The short-term sentiment for MU is currently Bullish because Price experienced a sharp pullback but found strong support near the 20-week moving average (middle Bollinger Band). The current large green weekly candle indicates a strong bounce and potential resumption of the dominant uptrend. RSI is also curling back up from the neutral 50 zone.. The long-term trend is classified as Bullish.
What are the key support levels for MU?
StockDips.AI has identified key support levels for MU at $730.00 and $475.00. These levels may represent potential accumulation zones where buying interest could emerge.
Is MU in a significant dip or a Value Dip right now?
MU has a Value Score of 42/100. It is not currently flagged as a significant dip in the Top Dips list. It is not listed as a Value Dip because the long-term sentiment or value-score threshold does not qualify.
View the full interactive analysis on StockDips.AI.