MU Monthly Technical Analysis
Micron Technology Inc
American producer of computer memory and data storage solutions, including DRAM (dynamic random-access memory) and NAND flash memory products. Their products are essential for a wide range of applications, from personal computers and mobile devices to data centers and automotive systems.
MU Technical Analysis Summary
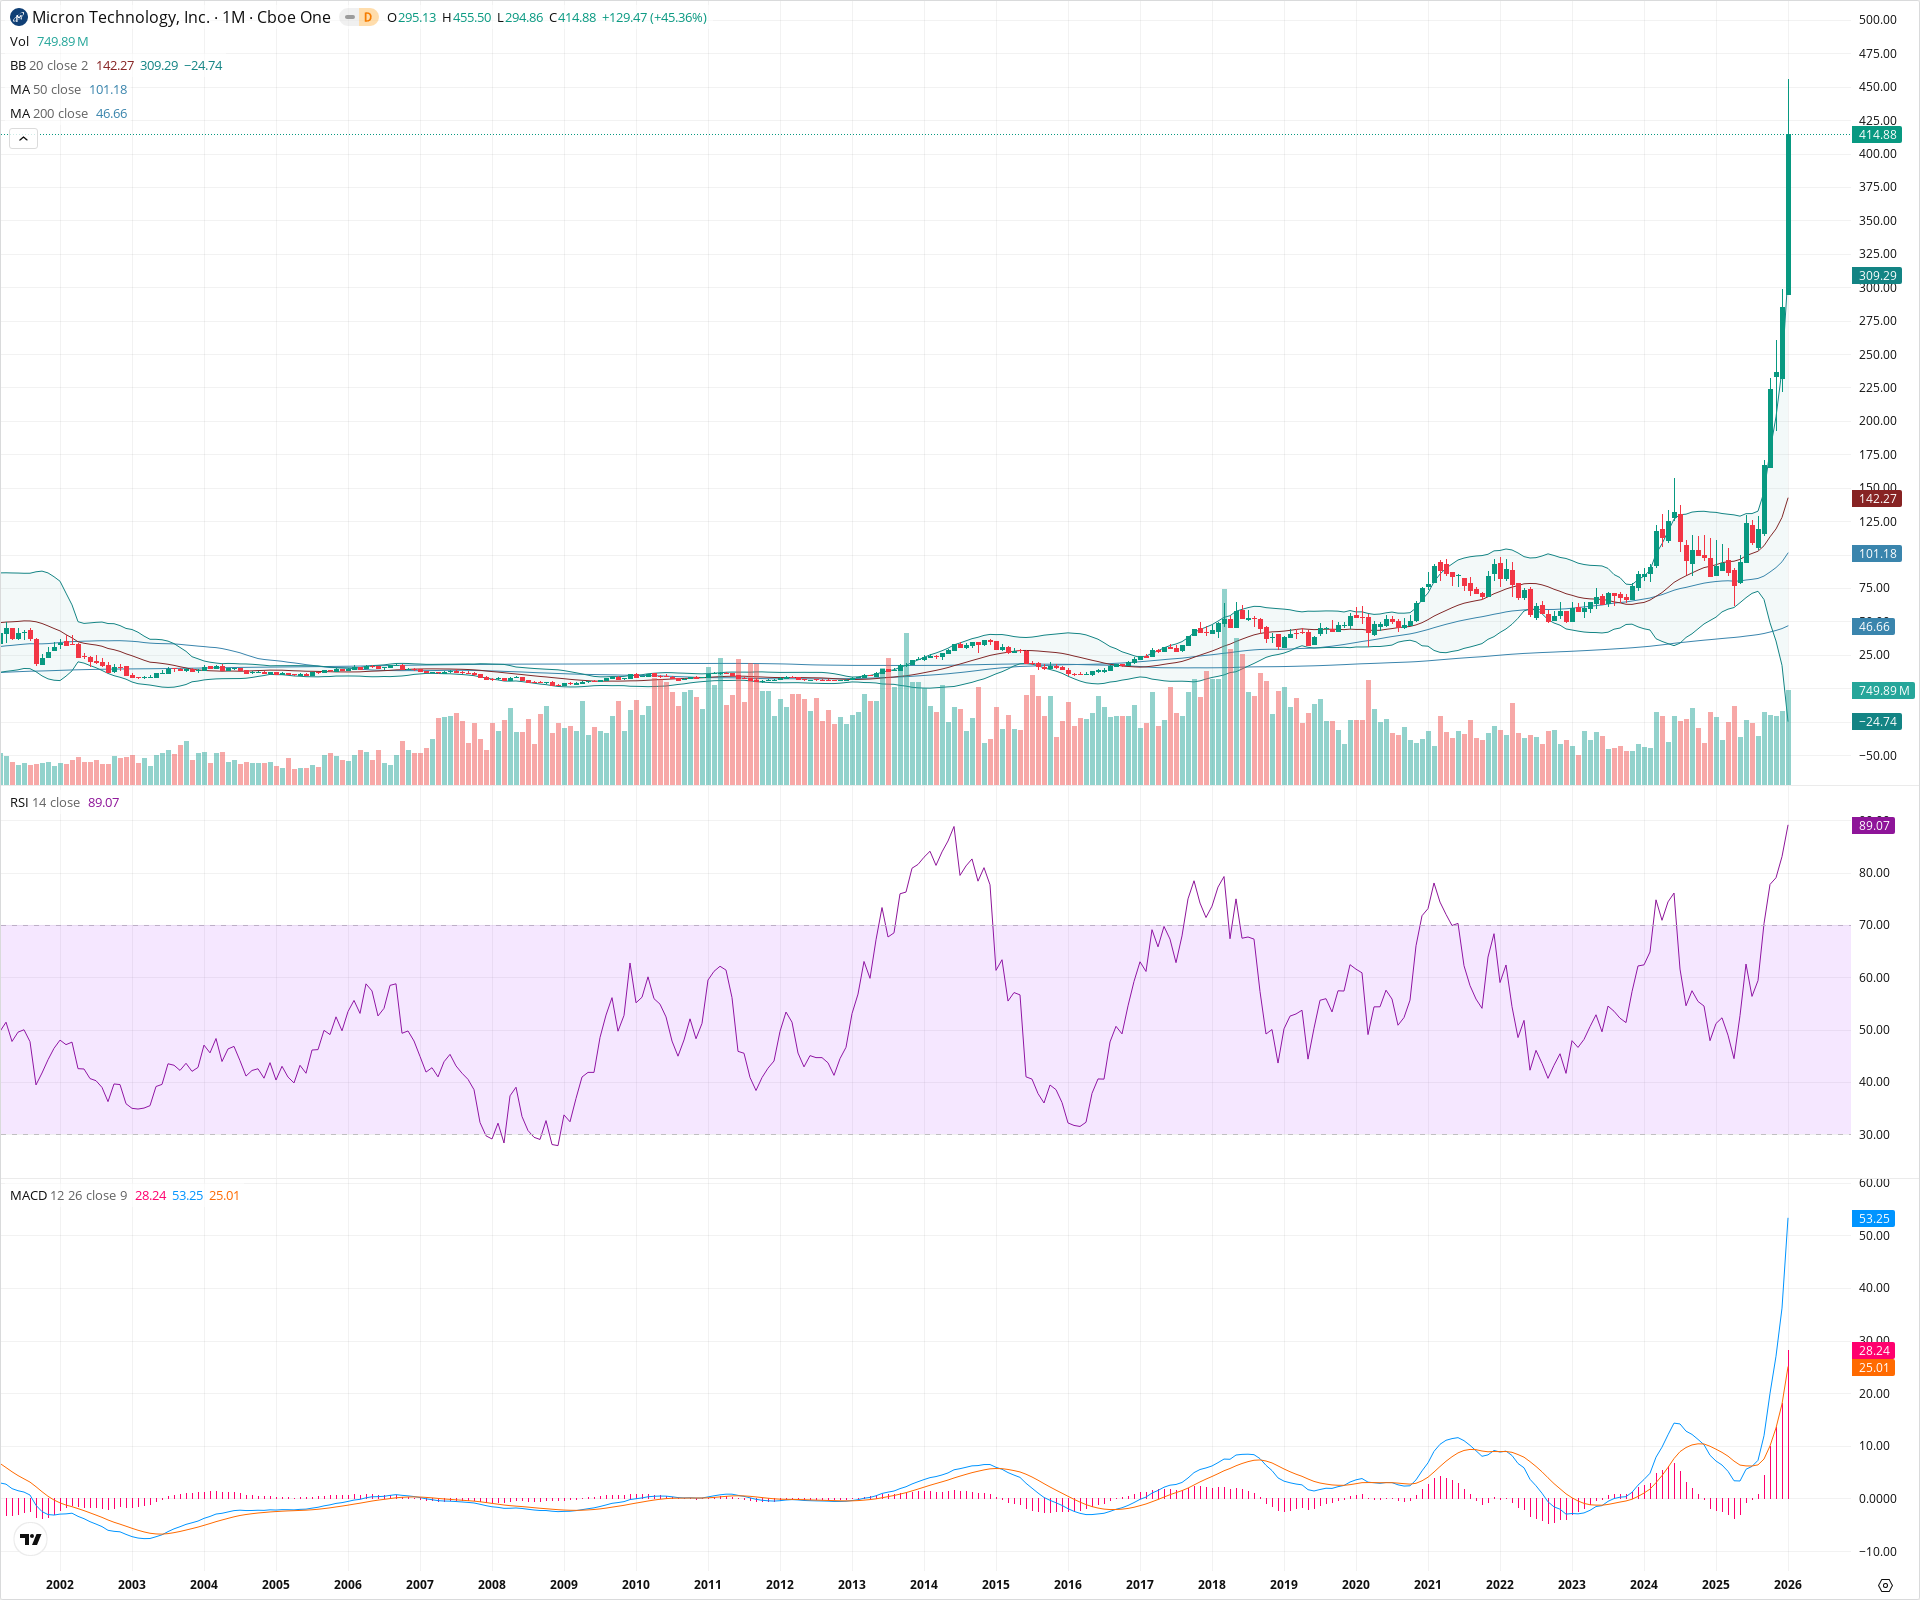
Micron Technology is experiencing a historic parabolic run, breaking into price discovery with extreme momentum, evidenced by an RSI near 90 and price far exceeding the upper Bollinger Band. While the long-term structural trend is powerfully bullish following the breakout from the 100-150 base, the vertical nature of the recent move suggests elevated volatility and an extended condition. Investors are seeing a strong secular bull regime, though the distance from mean support levels (50 SMA at ~101) indicates a highly aggressive risk environment.
Included In Lists
Related Tickers of Interest
MU Monthly Chart
Sentiment
Short-term Sentiment (days to weeks): Bullish
Price is in a vertical parabolic discovery phase, trading near the top of a massive +45% monthly candle with expanding volume and MACD divergence.
Long-term Sentiment (weeks to months): Bullish
The stock has confirmed a multi-decade breakout above all historical resistance, supported by a widening positive MACD and trending moving averages.
Report Metadata
- Timeframe: monthly
- Generated at: 2026-02-02T06:46:36.111Z
- Model: gemini-3-pro-preview
Support Price Levels
| Level | Range | Strength | Notes |
|---|---|---|---|
| $297.00 | $294.00 - $300.00 | Weak | Current month's low and psychological round number; immediate support in a vertical trend. |
| $155.00 | $150.00 - $160.00 | Strong | Former all-time high and breakout zone prior to the current parabolic extension. |
| $100.00 | $95.00 - $105.00 | Strong | Major structural base and breakout level from the 2022-2023 consolidation period. |
Resistance Price Levels
| Level | Range | Strength | Notes |
|---|---|---|---|
| $455.50 | $455.50 - $455.50 | Weak | Current all-time high achieved during the current active monthly candle. |
| $500.00 | $500.00 - $500.00 | Strong | Major psychological level and potential extension target. |
Potential Chart Patterns in Formation
| Strength | Pattern | Signal | Target | Details |
|---|---|---|---|---|
| Strong | Parabolic Breakout | Bullish | N/A | Price has gone vertical, detaching significantly from moving averages and upper Bollinger Bands. |
| Strong | Multi-Year Base Breakout | Bullish | N/A | Successful breakout from a long-term consolidation zone (approx. 2018-2023) above the 100 level. |
Frequently Asked Questions about MU
What is the current sentiment for MU?
The short-term sentiment for MU is currently Bullish because Price is in a vertical parabolic discovery phase, trading near the top of a massive +45% monthly candle with expanding volume and MACD divergence.. The long-term trend is classified as Bullish.
What are the key support levels for MU?
StockDips.AI has identified key support levels for MU at $297.00 and $155.00. These levels may represent potential accumulation zones where buying interest could emerge.
Is MU in a significant dip or a Value Dip right now?
MU has a Value Score of 42/100. It is not currently flagged as a significant dip in the Top Dips list. It is not listed as a Value Dip because the long-term sentiment or value-score threshold does not qualify.
View the full interactive analysis on StockDips.AI.