NFLX Monthly Technical Analysis
Netflix Inc
Leading video streaming service producing and distributing original and licensed content.
NFLX Technical Analysis Summary
Netflix is undergoing a significant mean-reversion correction following a parabolic advance, marked by a bearish MACD crossover and a breakdown below the 20-month SMA. While the immediate momentum is heavily bearish suggesting further downside testing, the secular trend remains bullish as long as the price holds above the major structural support zone near 60.00-70.00. Investors should watch for stabilization around the 50-month SMA to determine if this is a buying opportunity within a long-term uptrend or a deeper trend reversal.
Included In Lists
Related Tickers of Interest
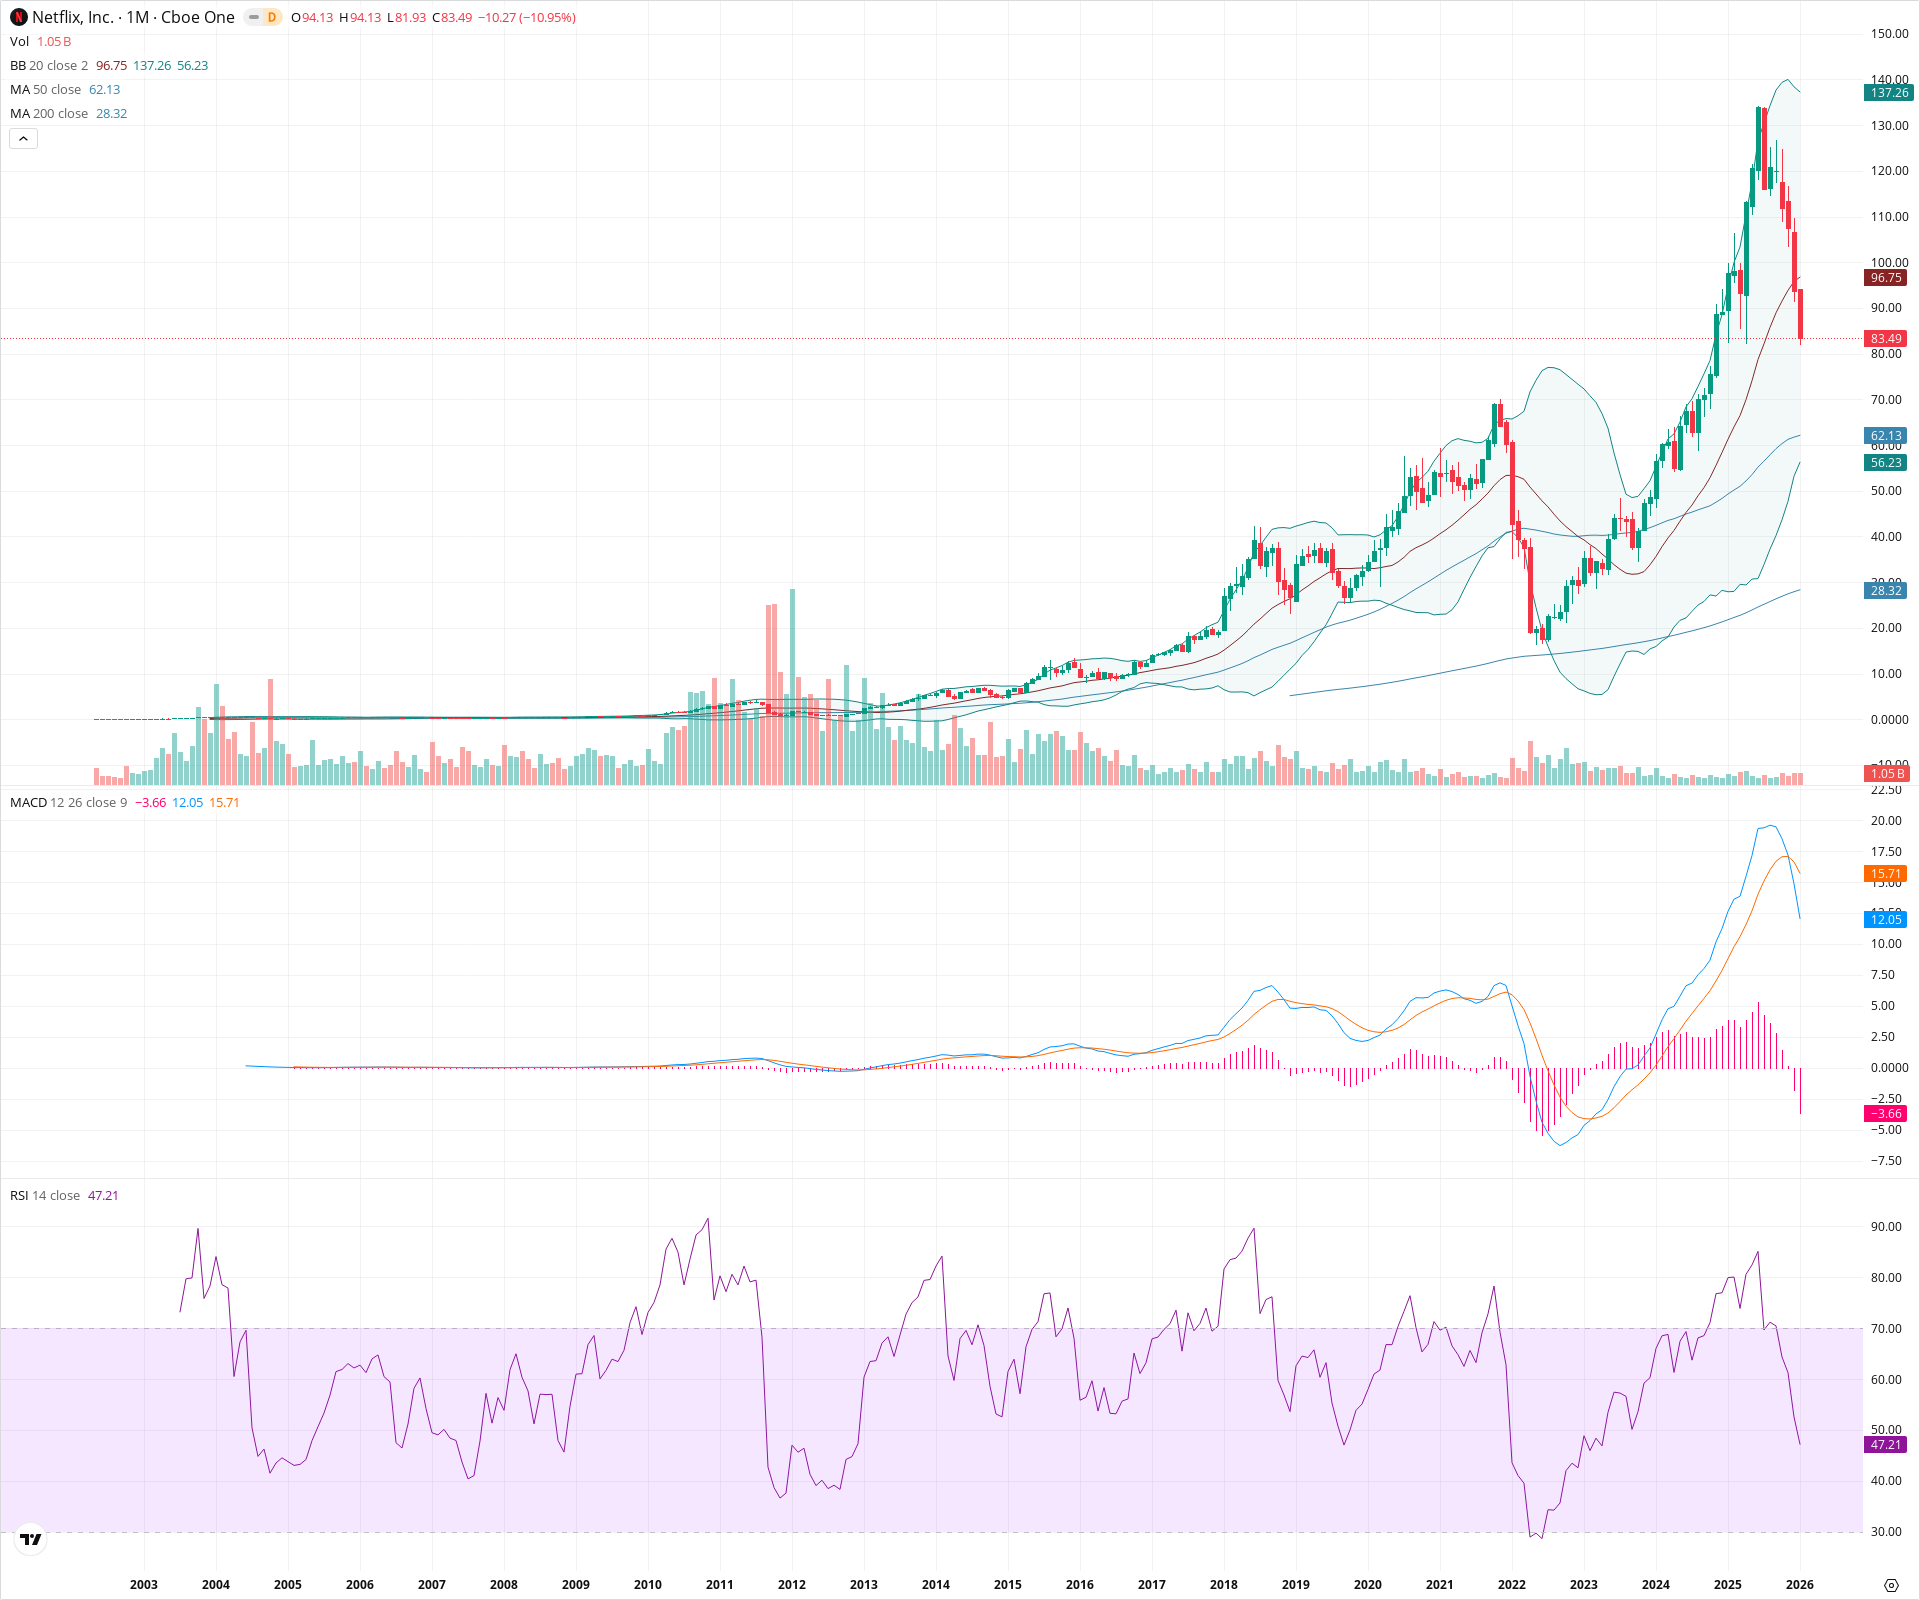
NFLX Monthly Chart
Sentiment
Short-term Sentiment (days to weeks): Bearish
The price has closed sharply lower with a large red candle, breaking below the 20-month SMA (96.75). A bearish MACD crossover (signal line above MACD line) and a declining RSI indicate strong downward momentum.
Long-term Sentiment (weeks to months): Bullish
Despite the sharp correction, the long-term structure remains bullish with the price trading well above the rising 50-month (62.13) and 200-month (28.32) SMAs. The sequence of higher highs and higher lows from the 2022 bottom is still intact.
Report Metadata
- Timeframe: monthly
- Generated at: 2026-02-02T06:47:19.412Z
- Model: gemini-3-pro-preview
Support Price Levels
| Level | Range | Strength | Notes |
|---|---|---|---|
| $65.00 | $60.00 - $70.00 | Strong | Confluence of the rising 50-month SMA and the previous multi-year resistance zone (2018-2021 highs) which should now act as support. |
| $29.00 | $28.00 - $30.00 | Strong | Major secular support aligned with the 200-month SMA and the consolidation base post-2022. |
Resistance Price Levels
| Level | Range | Strength | Notes |
|---|---|---|---|
| $97.00 | $96.00 - $98.00 | Weak | The 20-month SMA (Bollinger Band basis), which was recently broken, may now act as dynamic resistance on a bounce. |
| $141.00 | $137.00 - $145.00 | Strong | The recent all-time high zone and upper Bollinger Band interaction point representing the peak of the rally. |
Potential Chart Patterns in Formation
| Strength | Pattern | Signal | Target | Details |
|---|---|---|---|---|
| Strong | Rounding Bottom | Bullish | N/A | A massive multi-year base formed between 2022 and 2023, characterized by a gradual shift from selling to buying pressure, launching the subsequent rally. |
| Strong | Parabolic Blow-off | Bearish | N/A | The ascent into late 2025 became vertical, deviating significantly from the mean (50 SMA), followed by a sharp 'V' reversal typical of exhausted parabolic trends. |
Frequently Asked Questions about NFLX
What is the current sentiment for NFLX?
The short-term sentiment for NFLX is currently Bearish because The price has closed sharply lower with a large red candle, breaking below the 20-month SMA (96.75). A bearish MACD crossover (signal line above MACD line) and a declining RSI indicate strong downward momentum.. The long-term trend is classified as Bullish.
What are the key support levels for NFLX?
StockDips.AI has identified key support levels for NFLX at $65.00 and $29.00. These levels may represent potential accumulation zones where buying interest could emerge.
Is NFLX in a significant dip or a Value Dip right now?
NFLX has a Value Score of 46/100. It is not currently flagged as a significant dip in the Top Dips list. It is not listed as a Value Dip because the long-term sentiment or value-score threshold does not qualify.
View the full interactive analysis on StockDips.AI.