NUAI Monthly Technical Analysis
New Era Energy & Digital, Inc
Developer and operator of next-generation digital infrastructure and integrated power assets, focusing on building data centers to support AI and high-performance computing workloads. The company provides turnkey solutions to accelerate data center deployment for hyperscale, enterprise, and edge operators, leveraging its own natural gas reserves and land in the Permian Basin.
NUAI Technical Analysis Summary
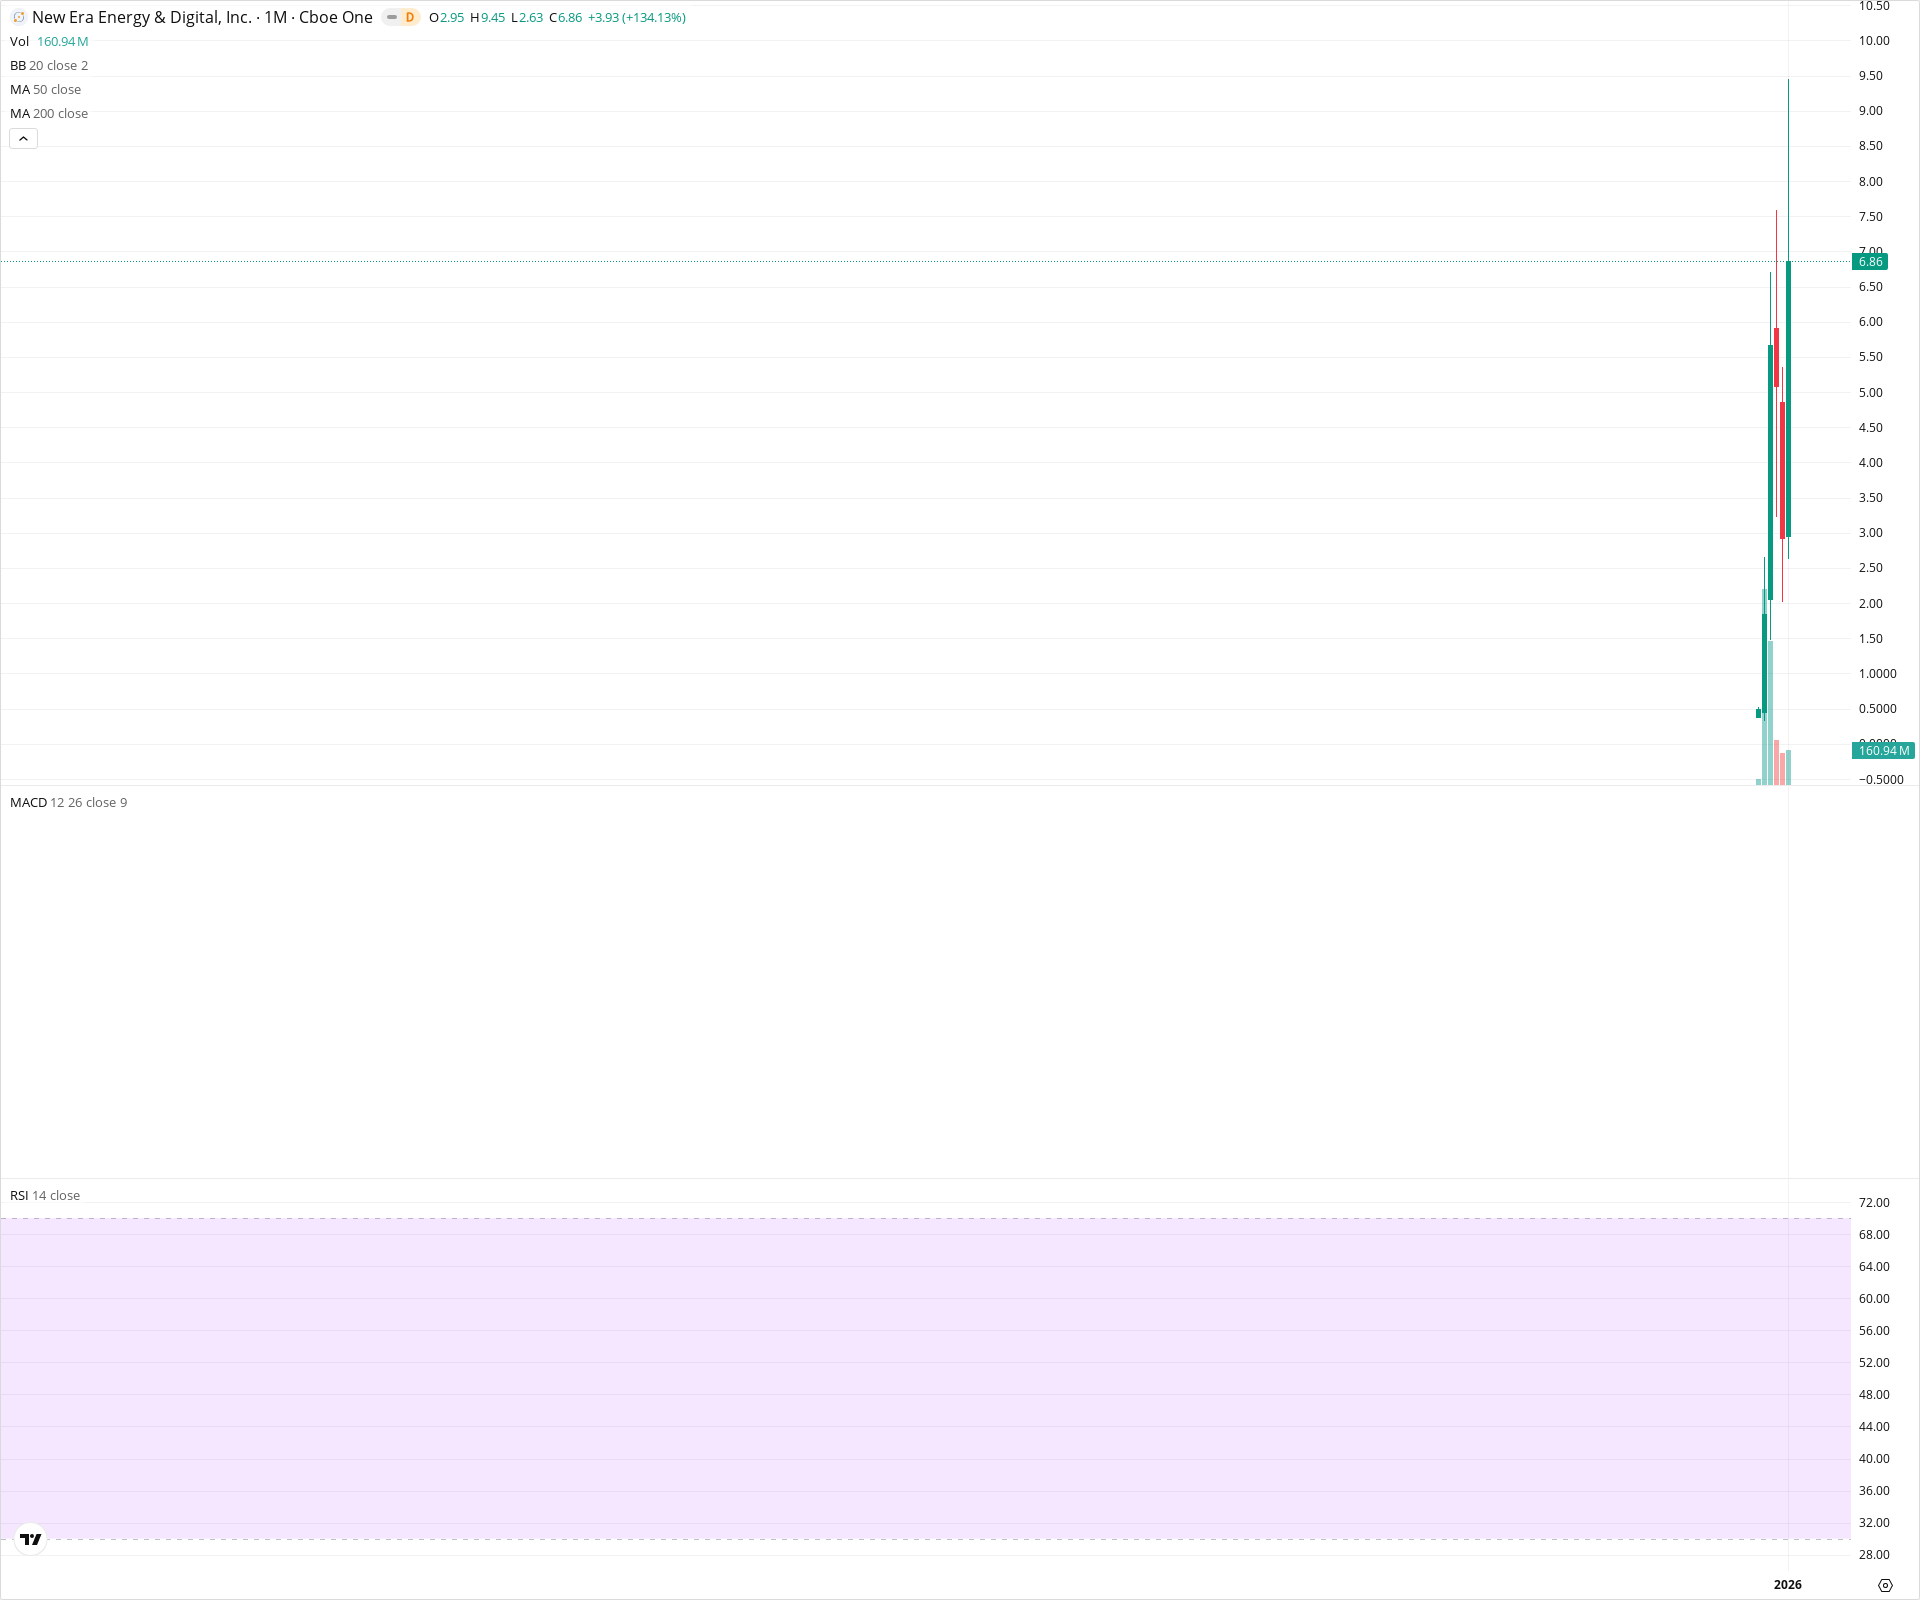
NUAI displays a parabolic chart structure with extremely limited history, characterized by a sudden, high-volume explosion from penny stock levels to near $10.00. The current monthly candle shows a gain of over 130% but features a long upper wick, indicating profit-taking and resistance near the $9.45 high. Due to the lack of historical data, long-term moving averages and oscillators like RSI and MACD are not yet established or populated. Investors should watch the $2.63–$2.95 zone as critical support to maintain this new bullish momentum.
Included In Lists
Related Tickers of Interest
NUAI Monthly Chart
Sentiment
Short-term Sentiment (days to weeks): Bullish
The stock is currently trading up over 134% for the month on massive volume, indicating extreme buying momentum despite a pullback from the highs.
Long-term Sentiment (weeks to months): Bullish
Price is in a vertical discovery phase, breaking out of a sub-$1.00 base to reach highs near $9.45, establishing a strong upward trajectory in the limited history available.
Report Metadata
- Timeframe: monthly
- Generated at: 2026-02-02T06:47:20.250Z
- Model: gemini-3-pro-preview
Support Price Levels
| Level | Range | Strength | Notes |
|---|---|---|---|
| $2.79 | $2.63 - $2.95 | Strong | Immediate support zone defined by the current month's open and low. |
| $0.85 | $0.50 - $1.20 | Strong | The base consolidation area prior to the current explosive breakout. |
Resistance Price Levels
| Level | Range | Strength | Notes |
|---|---|---|---|
| $9.45 | $9.45 - $9.45 | Strong | The all-time high set during the current month; serves as the primary overhead supply ceiling. |
| $10.00 | $10.00 - $10.00 | Weak | Psychological round number resistance just above the current highs. |
Potential Chart Patterns in Formation
| Strength | Pattern | Signal | Target | Details |
|---|---|---|---|---|
| Strong | Parabolic Breakout | Bullish | N/A | A massive vertical expansion in price and volume following a period of low activity, typical of a major catalyst or new listing discovery. |
Frequently Asked Questions about NUAI
What is the current sentiment for NUAI?
The short-term sentiment for NUAI is currently Bullish because The stock is currently trading up over 134% for the month on massive volume, indicating extreme buying momentum despite a pullback from the highs.. The long-term trend is classified as Bullish.
What are the key support levels for NUAI?
StockDips.AI has identified key support levels for NUAI at $2.79 and $0.85. These levels may represent potential accumulation zones where buying interest could emerge.
Is NUAI in a significant dip or a Value Dip right now?
NUAI has a Value Score of 62/100. It is not currently flagged as a significant dip in the Top Dips list. It is not listed as a Value Dip because the long-term sentiment or value-score threshold does not qualify.
View the full interactive analysis on StockDips.AI.