XOM Daily Technical Analysis
Exxon Mobil Corp.
Multinational oil and gas company engaged in exploration, refining, and chemicals.
XOM Technical Analysis Summary
XOM demonstrates a robust bullish technical posture across both timeframes. Following a significant correction and establishment of a higher low near the 200-day SMA, the asset has initiated a strong momentum breakout to the upside. While an RSI reading above 70 suggests the possibility of near-term consolidation, the overall trend and expanding MACD momentum heavily favor buyers aiming for prior structural highs.
Included In Lists
Related Tickers of Interest
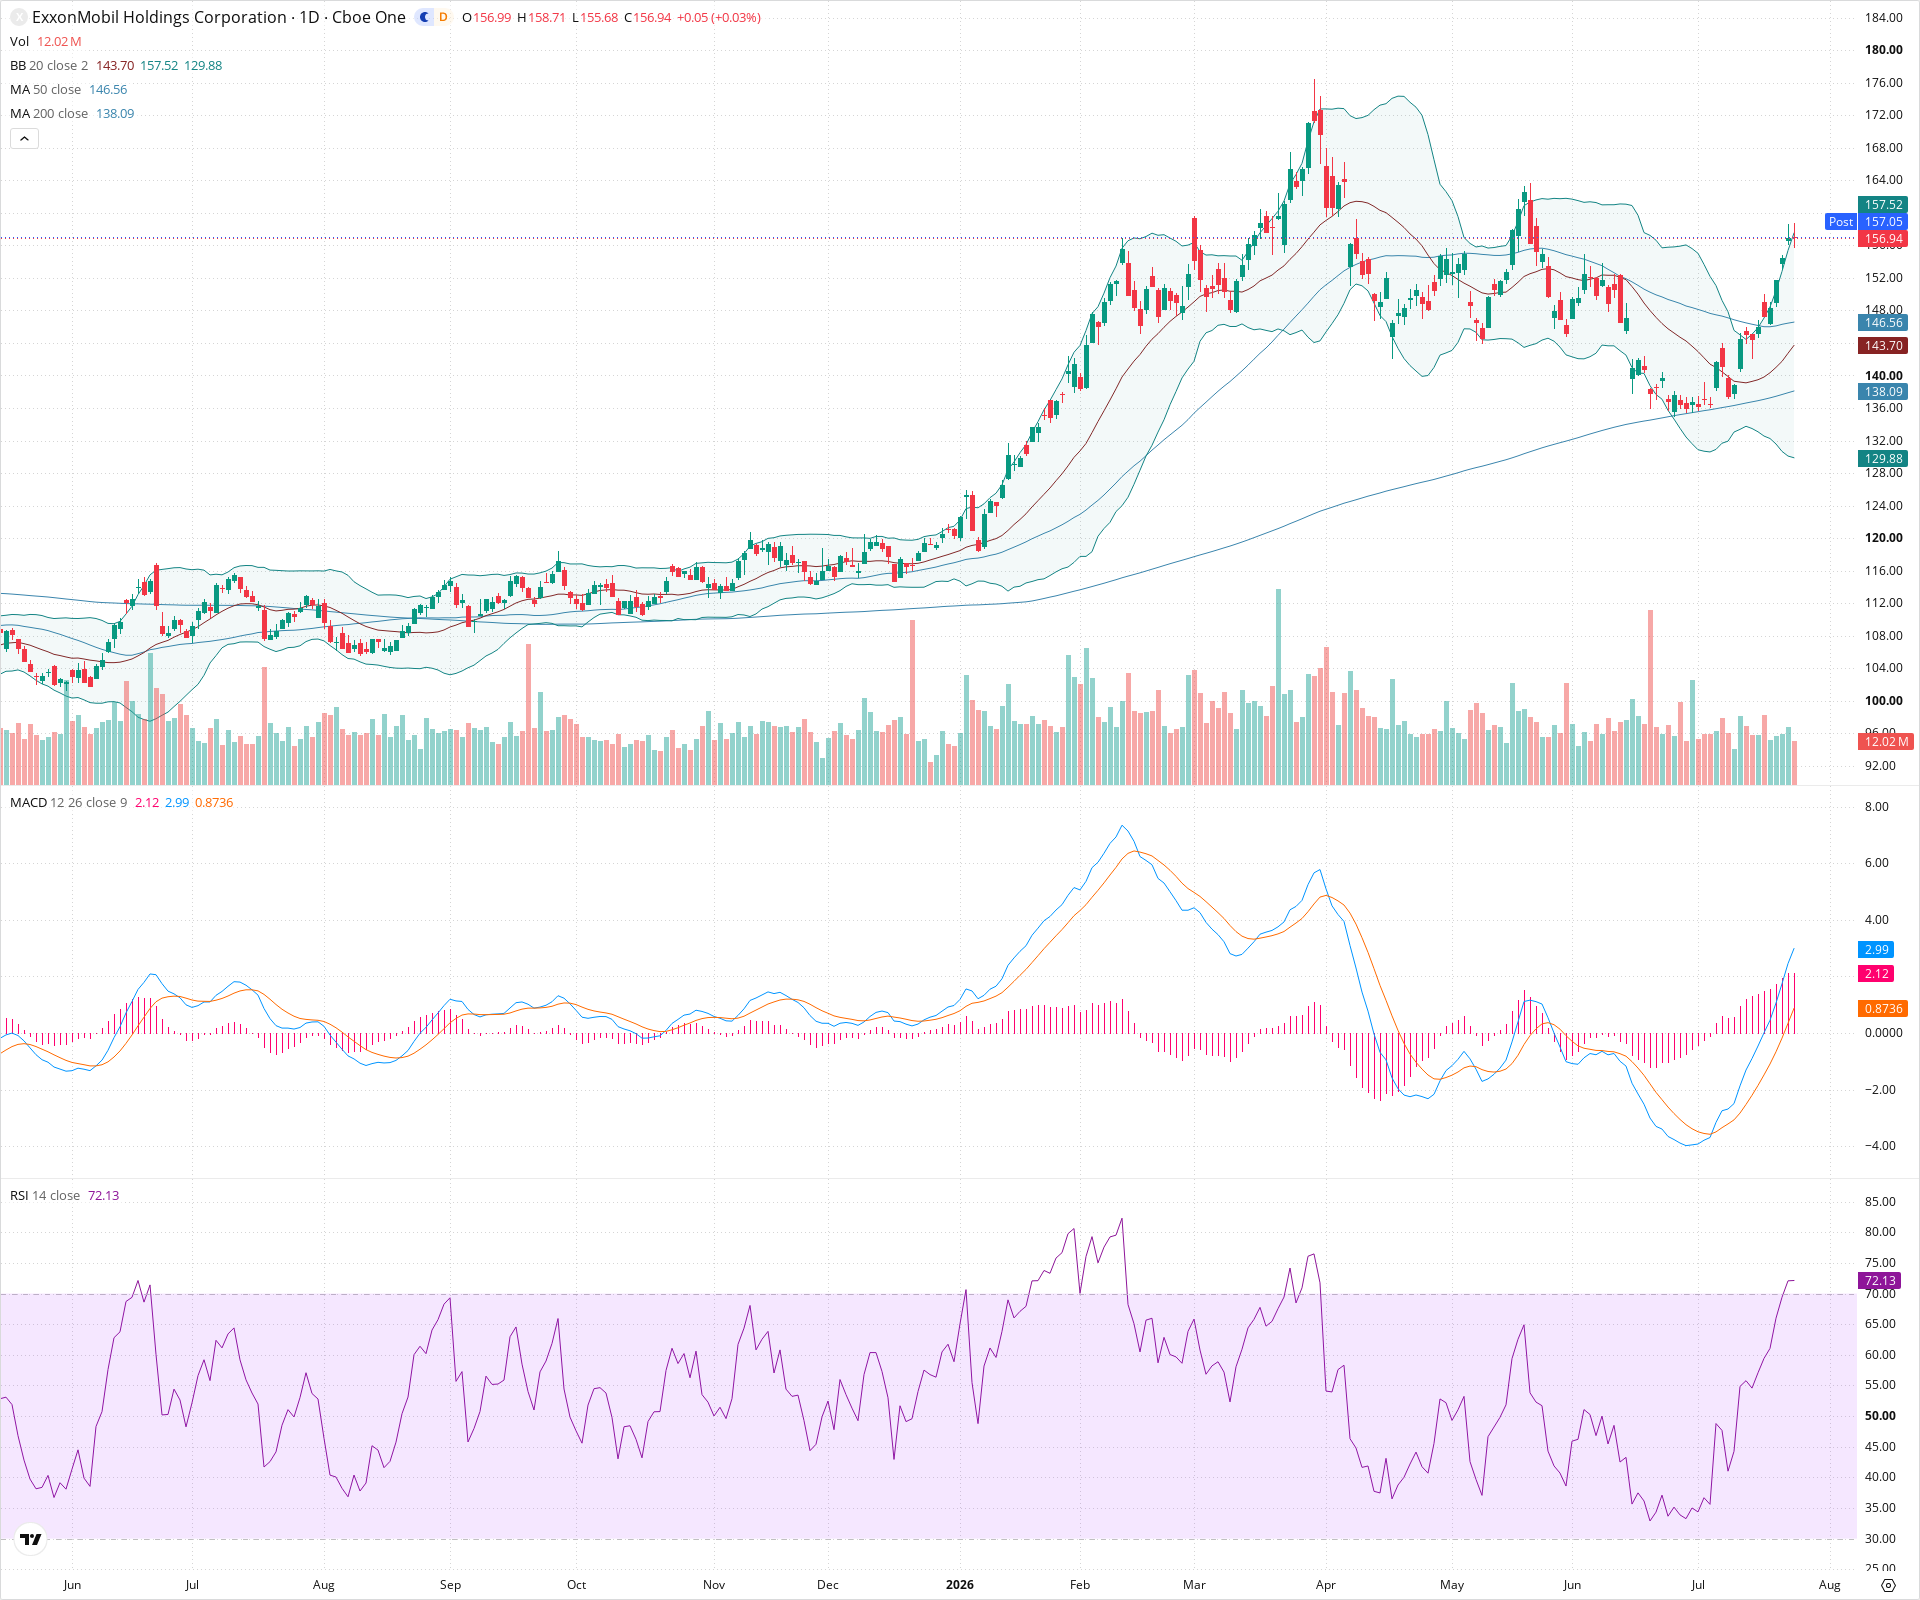
XOM Daily Chart
Sentiment
Short-term Sentiment (days to weeks): Bullish
Price is surging and riding the upper Bollinger Band, supported by a rising RSI entering overbought territory and a bullish MACD crossover with an expanding positive histogram.
Long-term Sentiment (weeks to months): Bullish
The price is well above both the 50-day and 200-day SMAs, which are positively aligned (50 > 200) and sloping upwards, indicating a sustained macro uptrend.
Report Metadata
- Timeframe: daily
- Generated at: 2026-07-24T21:14:15.000Z
- Model: gemini-3.1-pro-preview
Support Price Levels
| Level | Range | Strength | Notes |
|---|---|---|---|
| $145.00 | $143.00 - $147.00 | Strong | Convergence zone of the 50-day SMA, the middle Bollinger Band, and recent swing low consolidation. |
| $137.50 | $136.00 - $139.00 | Strong | Major structural swing low aligning with the rising 200-day SMA, forming a critical floor. |
Resistance Price Levels
| Level | Range | Strength | Notes |
|---|---|---|---|
| $162.00 | $160.00 - $164.00 | Weak | Prior minor swing high and consolidation zone established during a previous downtrend phase. |
| $174.00 | $172.00 - $176.00 | Strong | The major visible peak on the chart, representing significant historical supply. |
Potential Chart Patterns in Formation
| Strength | Pattern | Signal | Target | Details |
|---|---|---|---|---|
| Strong | Momentum Breakout | Bullish | $164.00 | Price has aggressively broken upward from recent consolidation, confirmed by accelerating MACD momentum and strong consecutive bullish candles. |
Frequently Asked Questions about XOM
What is the current sentiment for XOM?
The short-term sentiment for XOM is currently Bullish because Price is surging and riding the upper Bollinger Band, supported by a rising RSI entering overbought territory and a bullish MACD crossover with an expanding positive histogram.. The long-term trend is classified as Bullish.
What are the key support levels for XOM?
StockDips.AI has identified key support levels for XOM at $145.00 and $137.50. These levels may represent potential accumulation zones where buying interest could emerge.
Is XOM in a significant dip or a Value Dip right now?
XOM has a Value Score of 30/100. It is not currently flagged as a significant dip in the Top Dips list. It is not listed as a Value Dip because the long-term sentiment or value-score threshold does not qualify.
View the full interactive analysis on StockDips.AI.