NVDA Weekly Technical Analysis
NVIDIA Corporation
Designs GPUs and AI chips for gaming, data centers, and artificial intelligence systems.
NVDA Technical Analysis Summary
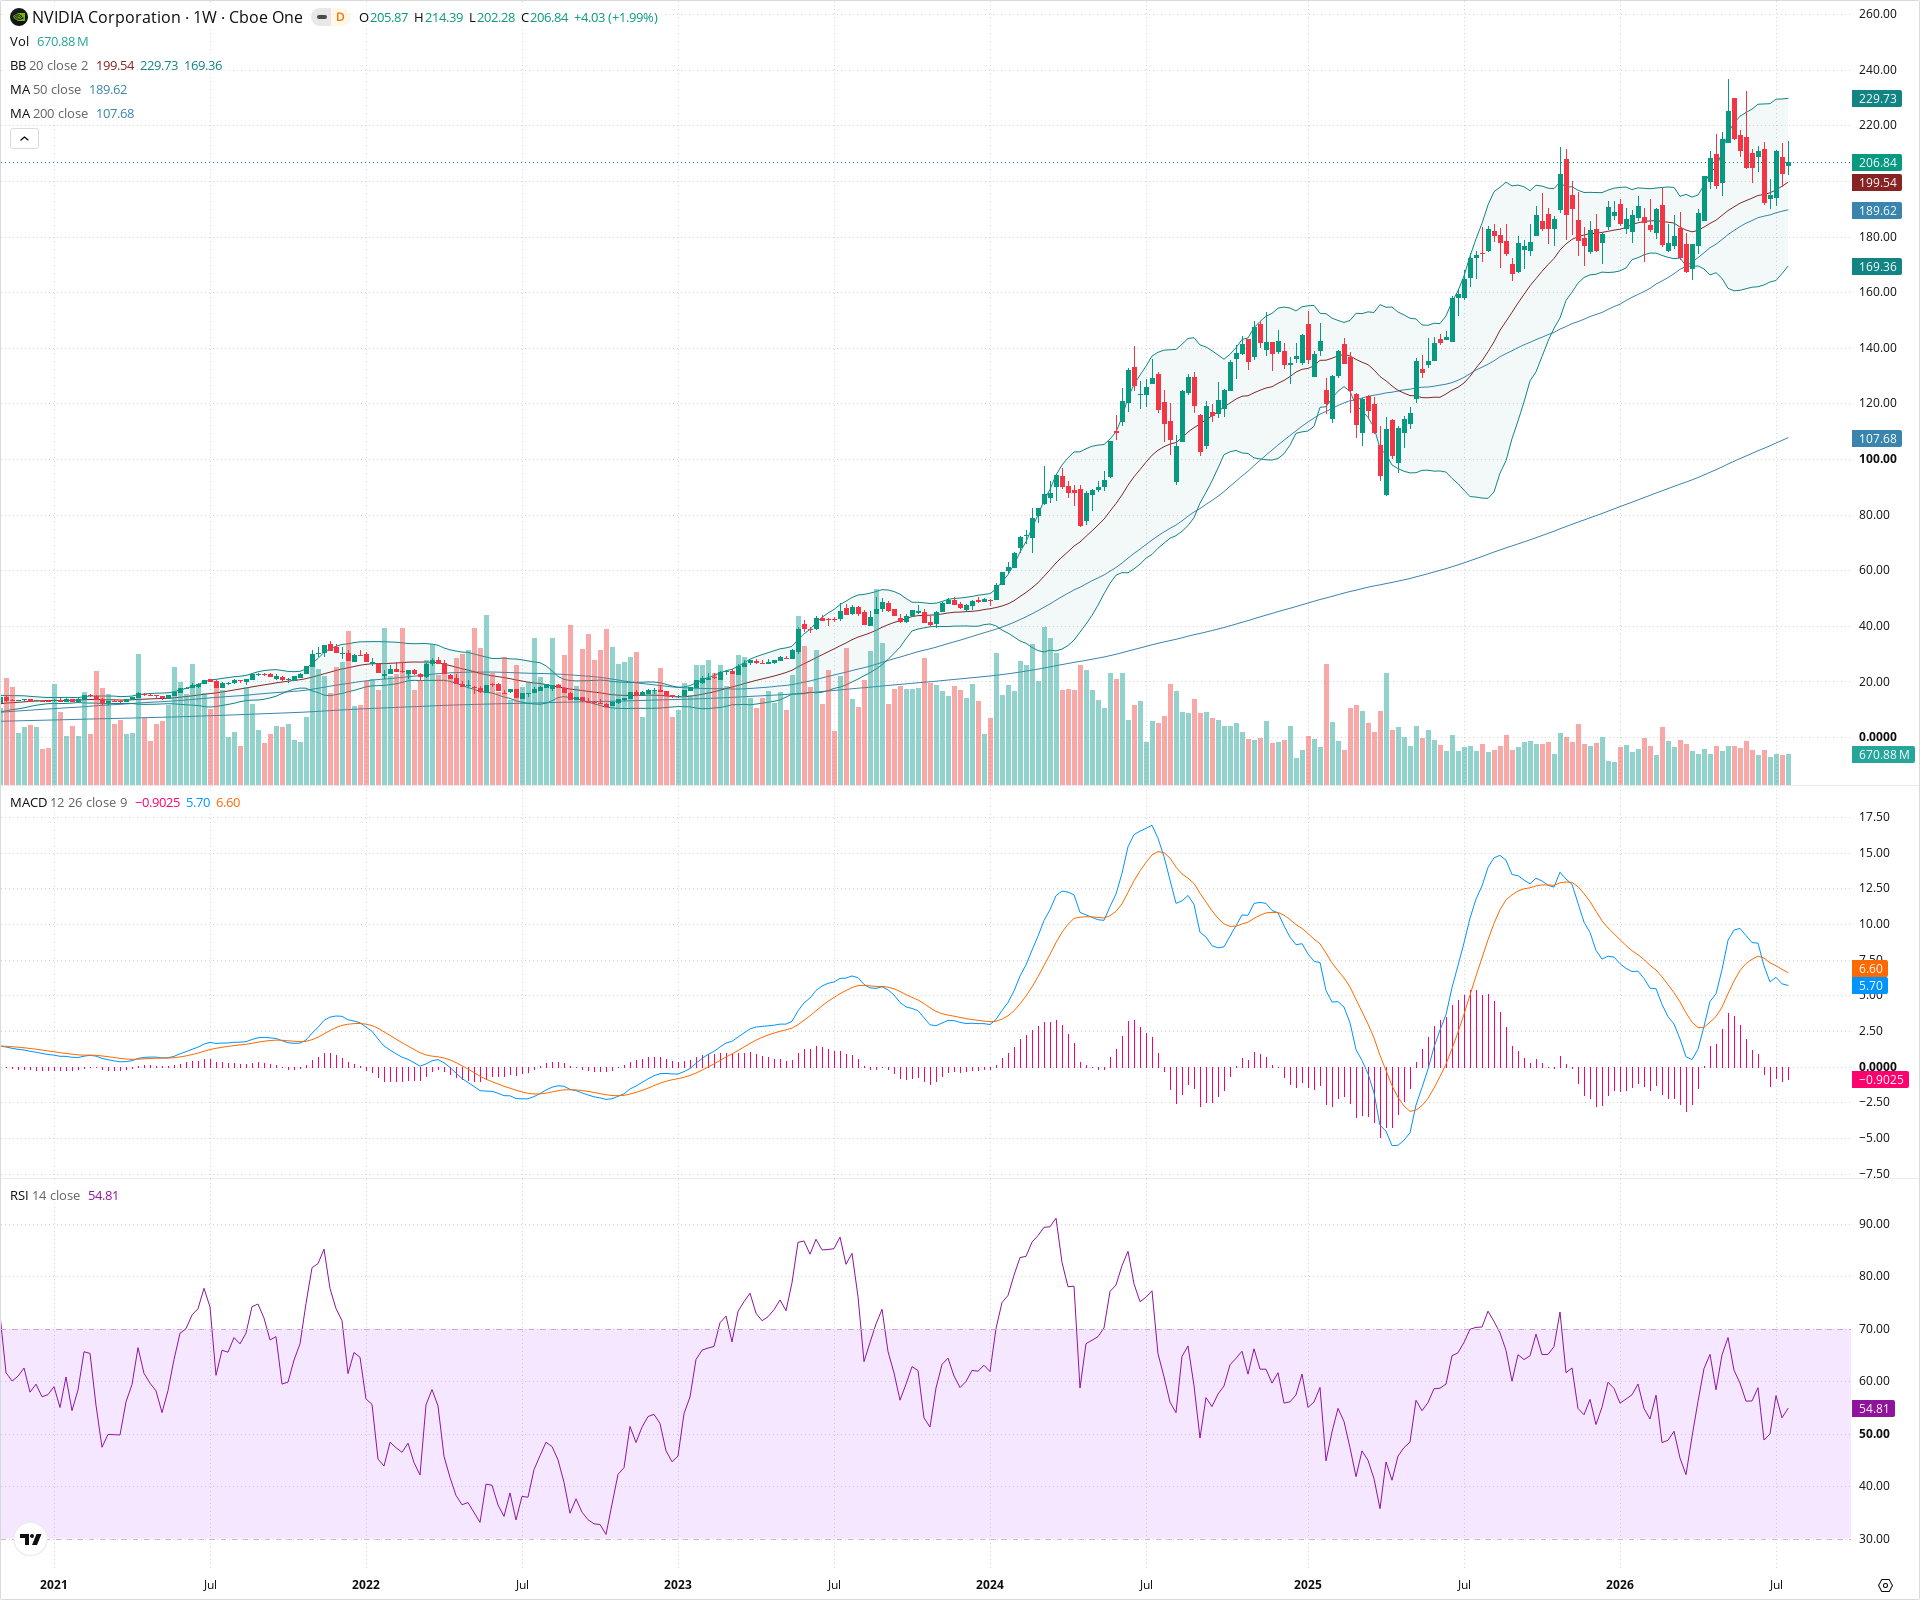
NVDA remains in a structurally strong long-term uptrend, evidenced by its position well above rising major moving averages. In the short to medium term, the stock is undergoing a normal period of consolidation, with momentum indicators like the MACD crossing bearishly to signal a pause in the rally. As long as key support in the 185-195 zone holds, the broader bullish thesis remains intact, though investors may need to be patient while the stock digests its massive run.
Included In Lists
Related Tickers of Interest
NVDA Weekly Chart
Sentiment
Short-term Sentiment (days to weeks): Neutral
Price is in a consolidation phase following a strong rally. The MACD has experienced a bearish crossover and the histogram is negative, indicating cooling momentum, yet price remains above the rising 50-week SMA and the 20-week SMA (middle Bollinger Band).
Long-term Sentiment (weeks to months): Bullish
The long-term structure remains firmly intact with the price maintaining a significant distance above both the upward-sloping 50-week and 200-week SMAs.
Report Metadata
- Timeframe: weekly
- Generated at: 2026-07-25T09:01:06.398Z
- Model: gemini-3.1-pro-preview
Support Price Levels
| Level | Range | Strength | Notes |
|---|---|---|---|
| $190.00 | $185.00 - $195.00 | Strong | Confluence of recent swing lows and the rising 50-week SMA (~189.62), acting as a dynamic support zone. |
| $162.50 | $160.00 - $165.00 | Strong | A major prior resistance zone from previous consolidation phases that should now act as strong structural support if tested. |
Resistance Price Levels
| Level | Range | Strength | Notes |
|---|---|---|---|
| $222.50 | $220.00 - $225.00 | Strong | Recent swing high area where the most recent attempt to rally was rejected. |
| $242.50 | $240.00 - $245.00 | Strong | The major peak and structural high visible on the chart; a breakout above this level would signal trend continuation. |
Potential Chart Patterns in Formation
| Strength | Pattern | Signal | Target | Details |
|---|---|---|---|---|
| Strong | Sideways Consolidation | Neutral | N/A | After a prolonged multi-month uptrend, the stock is currently chopping sideways in a volatile range roughly between 185 and 230, digesting previous gains. |
Frequently Asked Questions about NVDA
What is the current sentiment for NVDA?
The short-term sentiment for NVDA is currently Neutral because Price is in a consolidation phase following a strong rally. The MACD has experienced a bearish crossover and the histogram is negative, indicating cooling momentum, yet price remains above the rising 50-week SMA and the 20-week SMA (middle Bollinger Band).. The long-term trend is classified as Bullish.
What are the key support levels for NVDA?
StockDips.AI has identified key support levels for NVDA at $190.00 and $162.50. These levels may represent potential accumulation zones where buying interest could emerge.
Is NVDA in a significant dip or a Value Dip right now?
NVDA has a Value Score of 52/100. It is not currently flagged as a significant dip in the Top Dips list. It is not listed as a Value Dip because the long-term sentiment or value-score threshold does not qualify.
View the full interactive analysis on StockDips.AI.