PLTR Daily Technical Analysis
Palantir Technologies Inc
Builds data analytics and AI software for governments and enterprises.
PLTR Technical Analysis Summary
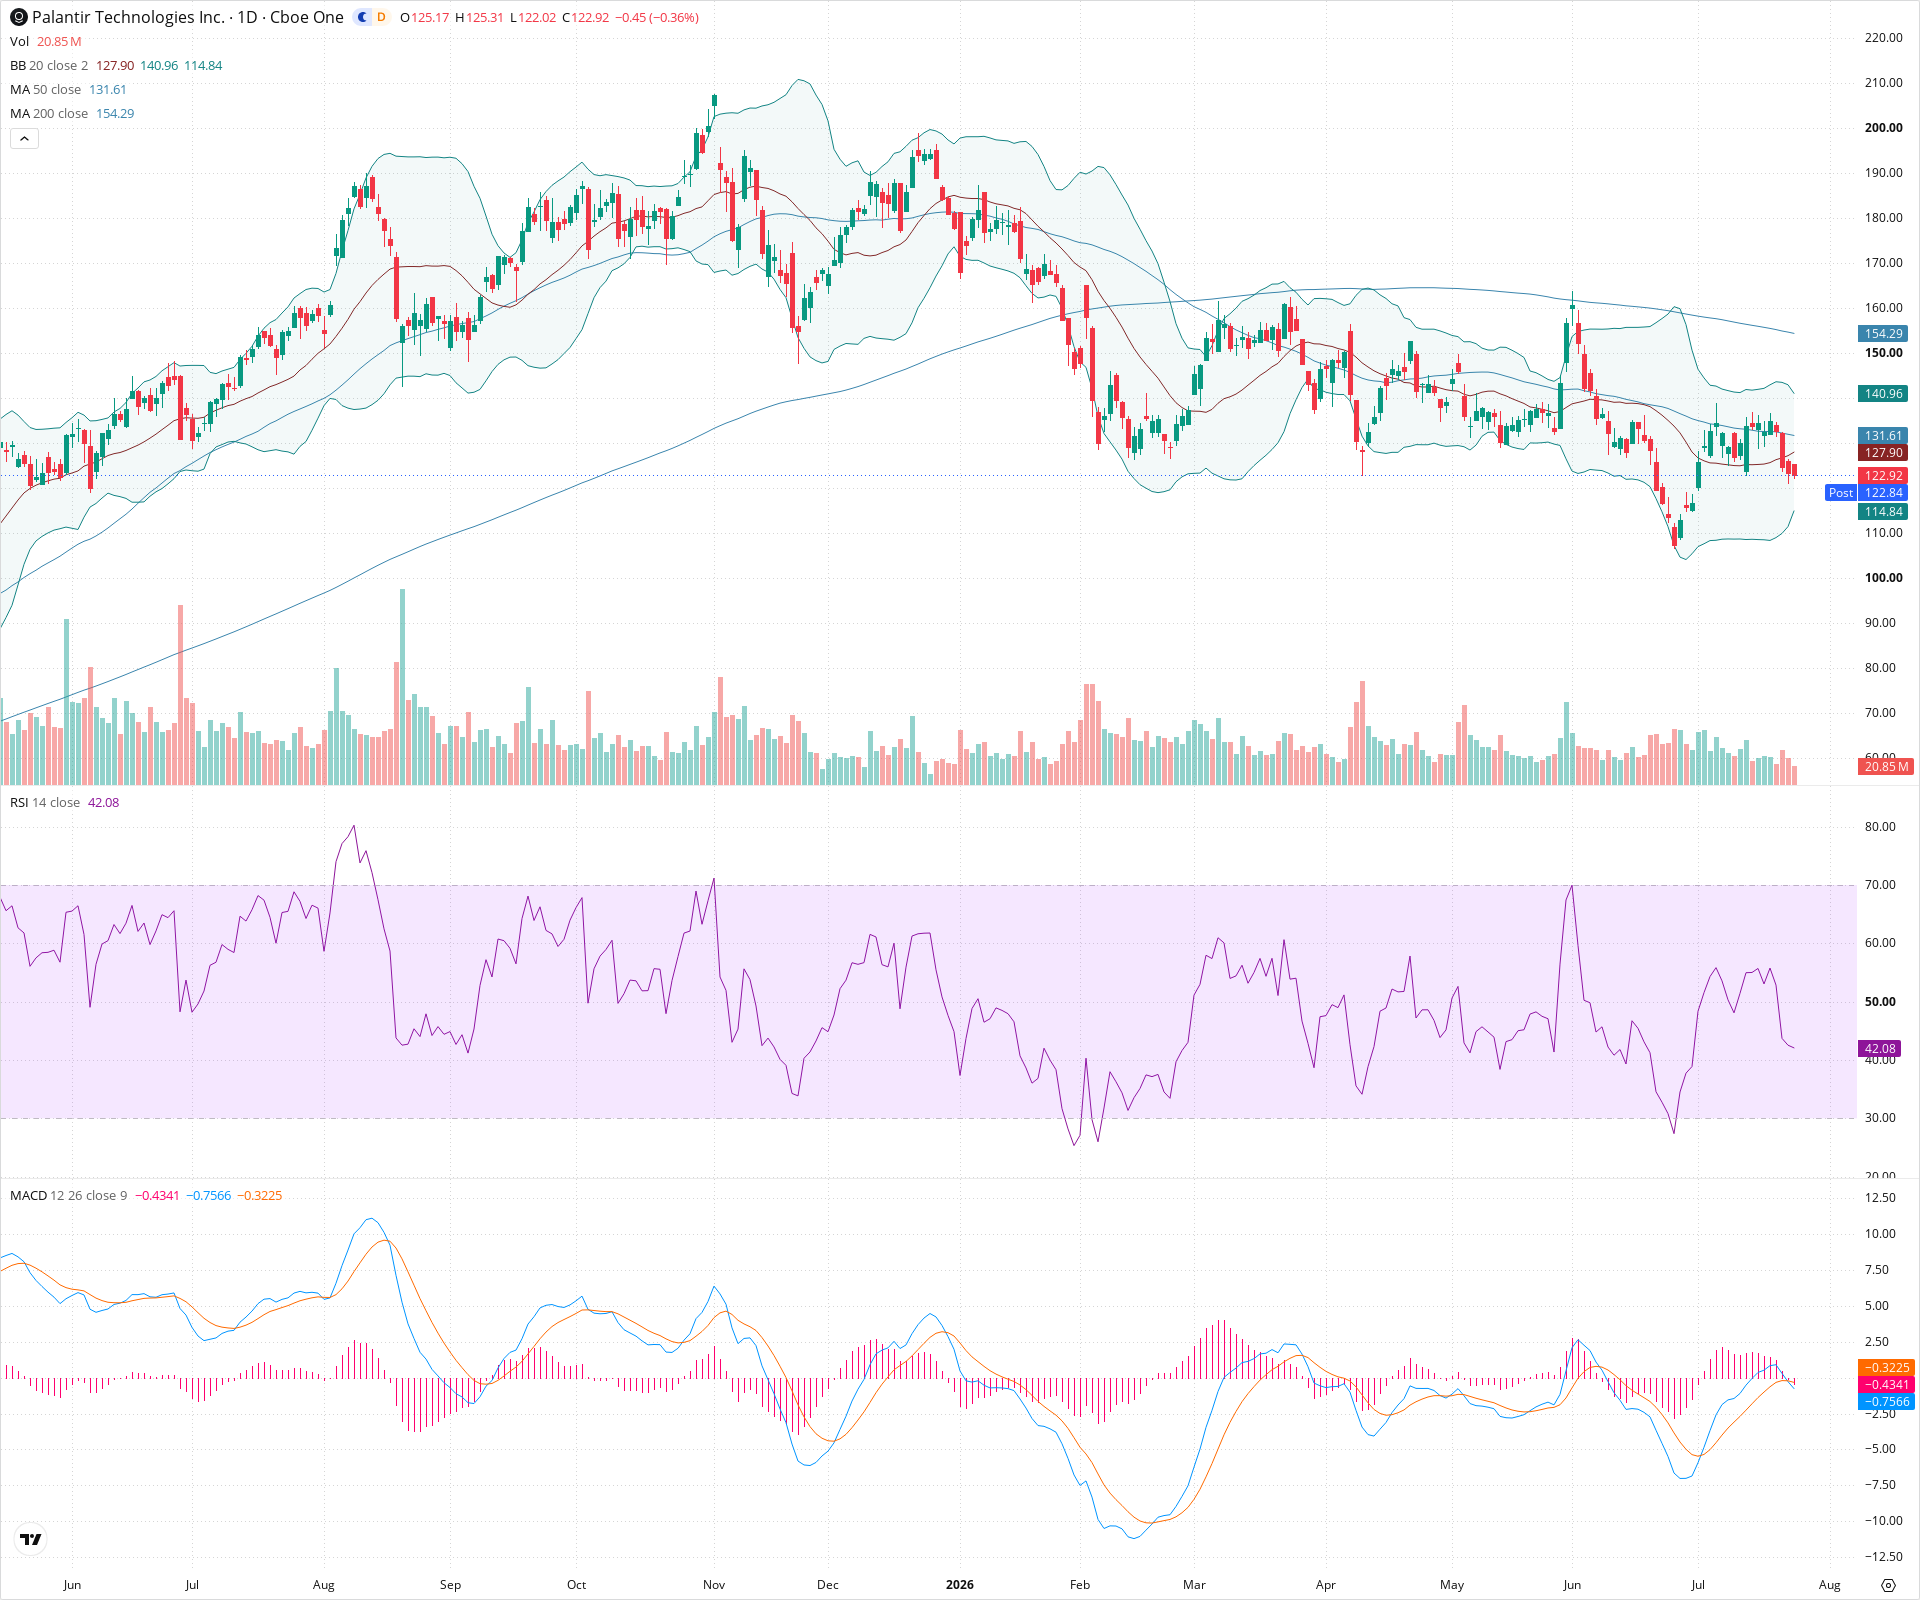
PLTR is firmly entrenched in a long-term structural downtrend, evidenced by its position well below key moving averages and a pattern of lower highs. While short-term momentum indicators suggest a temporary pause in selling pressure as price consolidates above recent lows, overhead resistance is dense. A convincing break above the 20-day and 50-day moving averages is required to shift the near-term bias, otherwise the path of least resistance remains downward.
Included In Lists
Related Tickers of Interest
PLTR Daily Chart
Sentiment
Short-term Sentiment (days to weeks): Neutral
Price is consolidating after a bounce off recent lows and the lower Bollinger Band. The RSI is rising from near-oversold territory, and the MACD histogram is showing decreasing bearish momentum, but price remains capped below the 20-day SMA.
Long-term Sentiment (weeks to months): Bearish
The stock is in a clear, sustained downtrend. Price action is consistently printing lower highs and lower lows, and trades well below both a declining 50-day SMA and a declining 200-day SMA.
Report Metadata
- Timeframe: daily
- Generated at: 2026-07-24T21:13:35.900Z
- Model: gemini-3.1-pro-preview
Support Price Levels
| Level | Range | Strength | Notes |
|---|---|---|---|
| $111.50 | $108.00 - $115.00 | Strong | Recent major swing low and confluence area with the lower Bollinger Band. |
Resistance Price Levels
| Level | Range | Strength | Notes |
|---|---|---|---|
| $129.50 | $127.00 - $132.00 | Strong | Immediate overhead resistance zone formed by the 20-day SMA and the 50-day SMA. |
| $142.50 | $140.00 - $145.00 | Weak | Prior swing lower-high and previous support zone that may act as resistance. |
| $152.50 | $150.00 - $155.00 | Strong | Major structural resistance marked by the declining 200-day SMA. |
Potential Chart Patterns in Formation
| Strength | Pattern | Signal | Target | Details |
|---|---|---|---|---|
| Strong | Descending Channel | Bearish | N/A | Price has been oscillating downwards between parallel trendlines connecting lower highs and lower lows over the past several months. |
Frequently Asked Questions about PLTR
What is the current sentiment for PLTR?
The short-term sentiment for PLTR is currently Neutral because Price is consolidating after a bounce off recent lows and the lower Bollinger Band. The RSI is rising from near-oversold territory, and the MACD histogram is showing decreasing bearish momentum, but price remains capped below the 20-day SMA.. The long-term trend is classified as Bearish.
What are the key support levels for PLTR?
StockDips.AI has identified key support levels for PLTR at $111.50. These levels may represent potential accumulation zones where buying interest could emerge.
Is PLTR in a significant dip or a Value Dip right now?
PLTR has a Value Score of 36/100. It is not currently flagged as a significant dip in the Top Dips list. It is not listed as a Value Dip because the long-term sentiment or value-score threshold does not qualify.
View the full interactive analysis on StockDips.AI.