NVDA Monthly Technical Analysis
NVIDIA Corporation
Designs GPUs and AI chips for gaming, data centers, and artificial intelligence systems.
NVDA Technical Analysis Summary
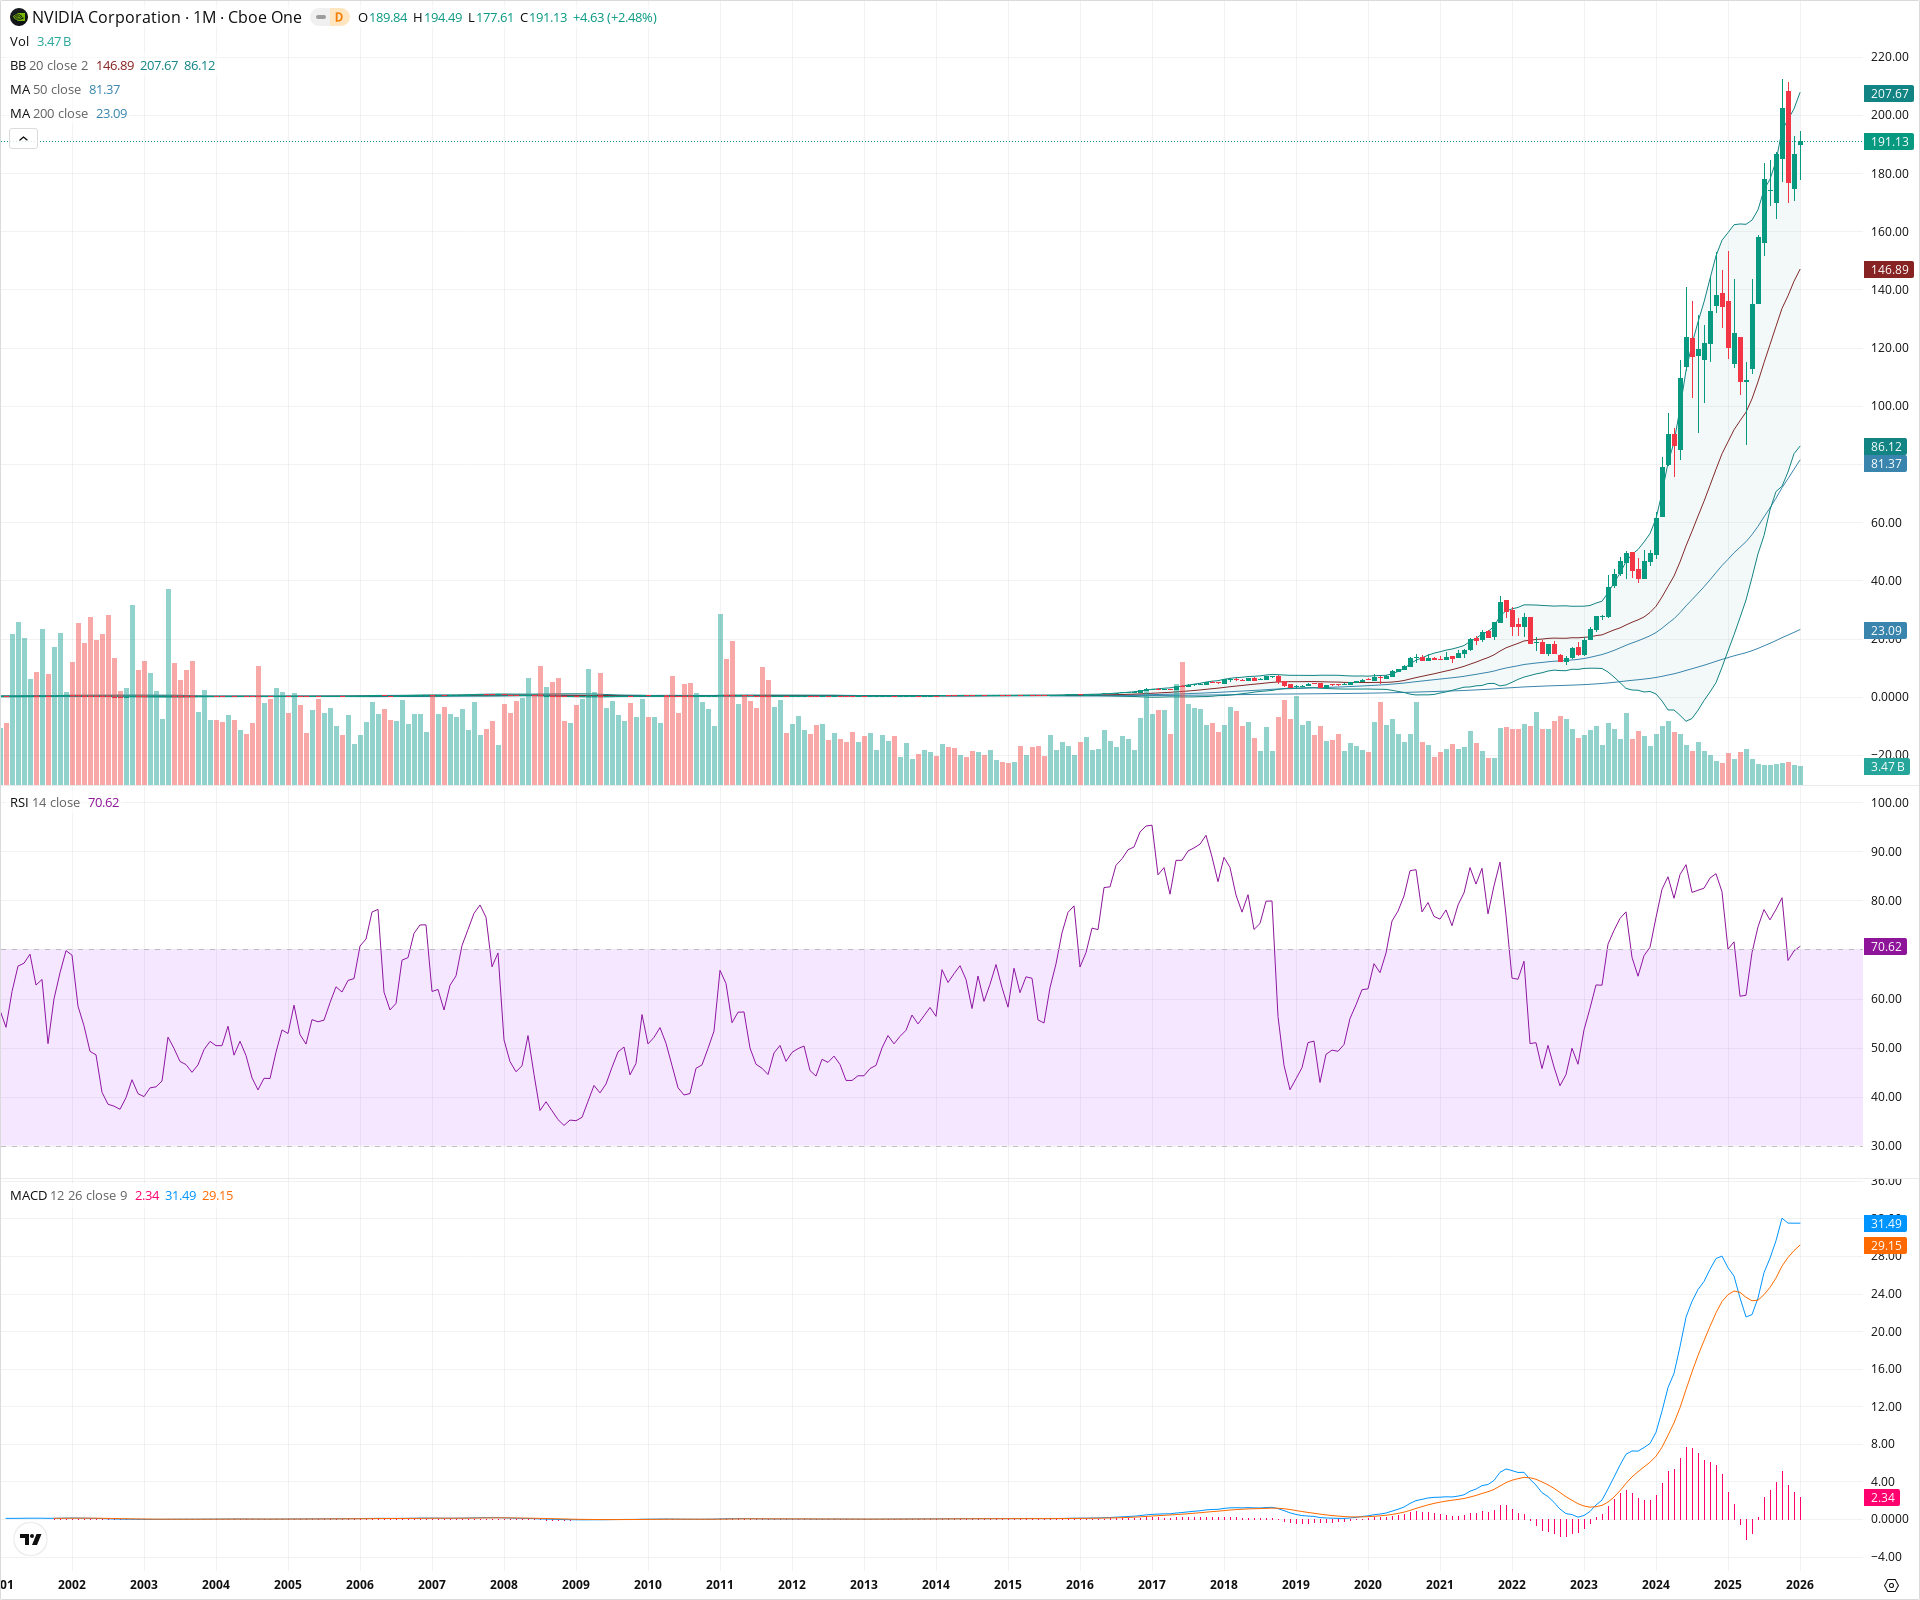
NVDA is in a dominant secular bull market, characterized by parabolic price action and strong momentum readings, with the RSI recently entering overbought territory (70.62) which often signals trend continuation on monthly timeframes. The stock is holding well above its rising 20-month SMA, suggesting the long-term trend remains intact despite high volatility. Investors should watch the 140-150 zone as critical structural support, while the 200 psychological level and upper Bollinger Band present immediate upside resistance.
Included In Lists
Related Tickers of Interest
NVDA Monthly Chart
Sentiment
Short-term Sentiment (days to weeks): Bullish
Price is trading near all-time highs with a green monthly candle following a consolidation, supported by positive momentum indicators.
Long-term Sentiment (weeks to months): Bullish
Strong secular trend characterized by a perfect bullish alignment of moving averages (20>50>200) and sustained positive MACD regime.
Report Metadata
- Timeframe: monthly
- Generated at: 2026-02-02T06:47:53.343Z
- Model: gemini-3-pro-preview
Support Price Levels
| Level | Range | Strength | Notes |
|---|---|---|---|
| $145.00 | $140.00 - $150.00 | Strong | Confluence of the 20-month SMA (146.89) and the recent breakout consolidation zone. |
| $95.00 | $90.00 - $100.00 | Strong | Major prior structural resistance turned support; aligns near the 50-month SMA (81.37). |
Resistance Price Levels
| Level | Range | Strength | Notes |
|---|---|---|---|
| $197.50 | $195.00 - $200.00 | Weak | Immediate psychological resistance and area of recent wicks. |
| $207.50 | $207.00 - $208.00 | Strong | Upper Bollinger Band (207.67) often acts as a dynamic volatility ceiling on monthly charts. |
Potential Chart Patterns in Formation
| Strength | Pattern | Signal | Target | Details |
|---|---|---|---|---|
| Strong | Parabolic Uptrend | Bullish | N/A | Price is accelerating vertically away from long-term moving averages, typical of a strong momentum phase. |
| Strong | Bull Flag Breakout | Bullish | N/A | Recent consolidation around the 130-140 level acted as a base for the current leg higher. |
Frequently Asked Questions about NVDA
What is the current sentiment for NVDA?
The short-term sentiment for NVDA is currently Bullish because Price is trading near all-time highs with a green monthly candle following a consolidation, supported by positive momentum indicators.. The long-term trend is classified as Bullish.
What are the key support levels for NVDA?
StockDips.AI has identified key support levels for NVDA at $145.00 and $95.00. These levels may represent potential accumulation zones where buying interest could emerge.
Is NVDA in a significant dip or a Value Dip right now?
NVDA has a Value Score of 52/100. It is not currently flagged as a significant dip in the Top Dips list. It is not listed as a Value Dip because the long-term sentiment or value-score threshold does not qualify.
View the full interactive analysis on StockDips.AI.