RKLB Weekly Technical Analysis
Rocket Lab Corp
Aerospace company that provides an end-to-end space solutions platform, which includes designing, manufacturing, launching, and operating rockets and satellites for commercial, government, and defense customers.
RKLB Technical Analysis Summary
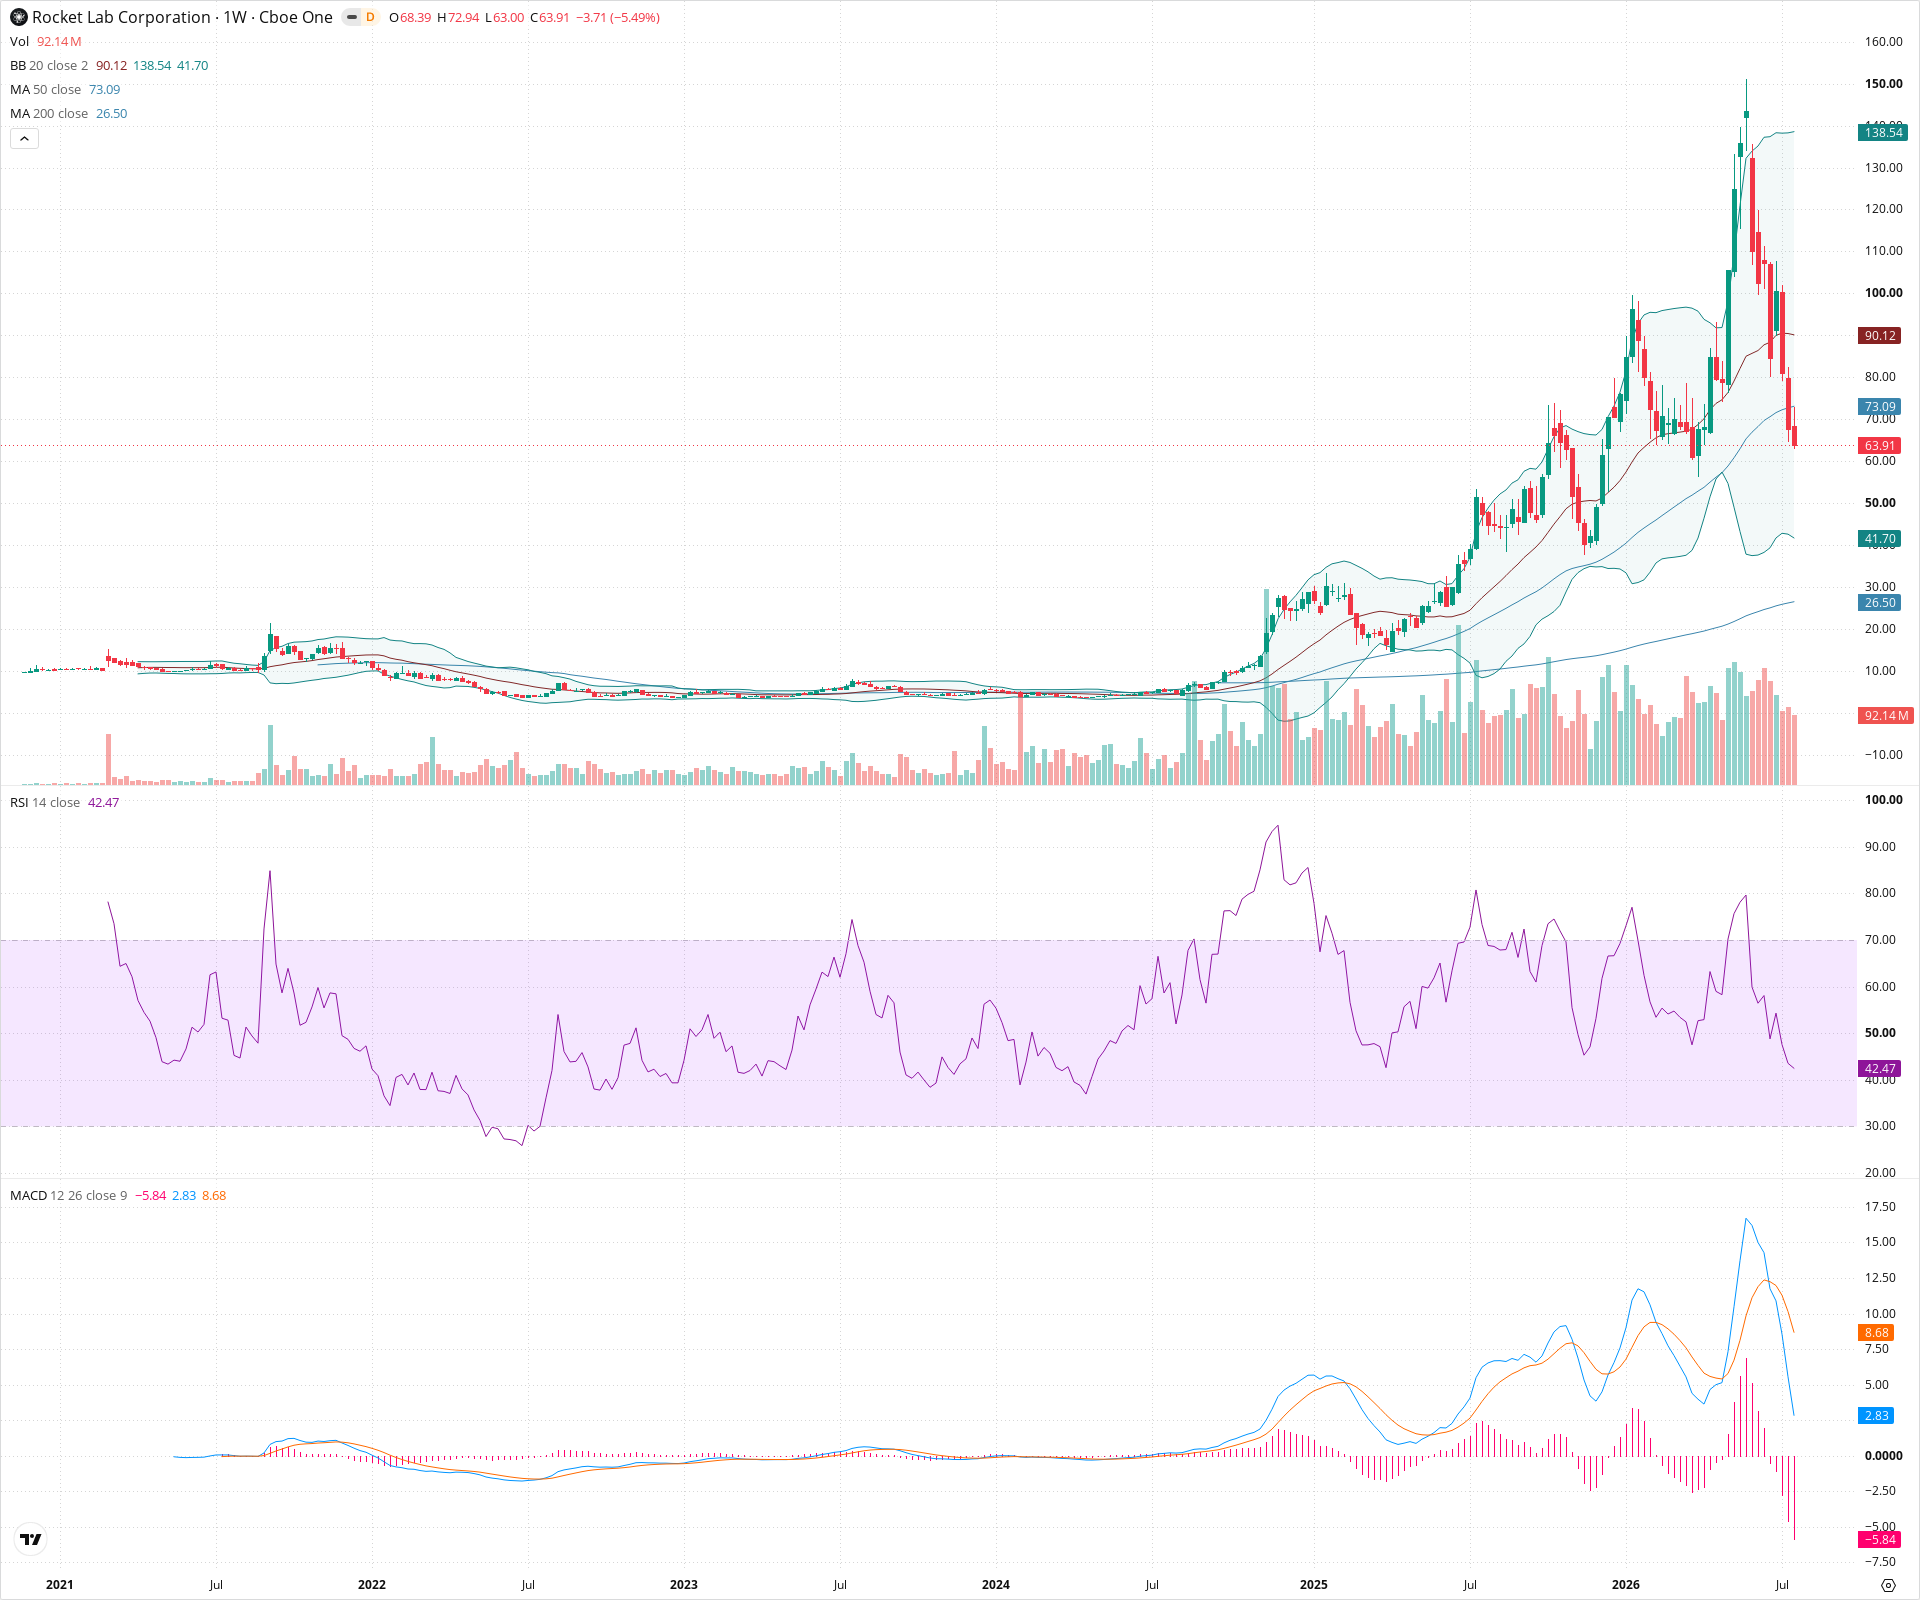
The technical picture for RKLB has deteriorated significantly following a parabolic blow-off top. The stock is currently in a severe weekly downtrend, having sliced through crucial support at the 50-week SMA. Downside momentum is accelerating, as evidenced by a steeply expanding negative MACD histogram and price action riding the lower Bollinger Band. Until a definitive floor is found and a new basing structure develops, the path of least resistance remains sharply lower.
Included In Lists
Related Tickers of Interest
RKLB Weekly Chart
Sentiment
Short-term Sentiment (days to weeks): Bearish
The stock is in a steep, near-vertical weekly downtrend, aggressively riding down the lower Bollinger Band. It has recently broken decisively below the 50-week SMA on expanding negative MACD momentum.
Long-term Sentiment (weeks to months): Bearish
A massive parabolic rally has aggressively reversed. The breakdown below the 50-week SMA indicates a major structural shift in the long-term trend, suggesting a prolonged period of distribution or deep retracement is underway.
Report Metadata
- Timeframe: weekly
- Generated at: 2026-07-25T09:09:21.700Z
- Model: gemini-3.1-pro-preview
Support Price Levels
| Level | Range | Strength | Notes |
|---|---|---|---|
| $60.00 | $55.00 - $65.00 | Strong | Current zone being tested. Aligns with a significant prior consolidation phase and swing high from mid-2025 before the final parabolic advance. |
| $42.50 | $40.00 - $45.00 | Strong | Major prior resistance zone that acted as a launchpad for the primary breakout in late 2024/early 2025. |
| $27.50 | $25.00 - $30.00 | Strong | Long-term base level, currently aligning with the slowly rising 200-week SMA. |
Resistance Price Levels
| Level | Range | Strength | Notes |
|---|---|---|---|
| $72.50 | $70.00 - $75.00 | Strong | Immediate overhead resistance primarily defined by the 50-week SMA and the bottom of the recent price breakdown. |
| $95.00 | $90.00 - $100.00 | Strong | A previous support zone that failed, now significant resistance. It aligns with the rapidly descending 20-week SMA. |
| $115.00 | $110.00 - $120.00 | Strong | Major lower swing high established during the topping process before the steepest part of the current decline began. |
Potential Chart Patterns in Formation
| Strength | Pattern | Signal | Target | Details |
|---|---|---|---|---|
| Strong | Parabolic Reversal | Bearish | N/A | A vertical, exponential price advance followed by an equally sharp, high-momentum decline, breaking major trendlines and moving averages. |
Frequently Asked Questions about RKLB
What is the current sentiment for RKLB?
The short-term sentiment for RKLB is currently Bearish because The stock is in a steep, near-vertical weekly downtrend, aggressively riding down the lower Bollinger Band. It has recently broken decisively below the 50-week SMA on expanding negative MACD momentum.. The long-term trend is classified as Bearish.
What are the key support levels for RKLB?
StockDips.AI has identified key support levels for RKLB at $60.00 and $42.50. These levels may represent potential accumulation zones where buying interest could emerge.
Is RKLB in a significant dip or a Value Dip right now?
RKLB has a Value Score of 68/100. It is not currently flagged as a significant dip in the Top Dips list. It is not listed as a Value Dip because the long-term sentiment or value-score threshold does not qualify.
View the full interactive analysis on StockDips.AI.