RKLB Monthly Technical Analysis
Rocket Lab Corp
Aerospace company that provides an end-to-end space solutions platform, which includes designing, manufacturing, launching, and operating rockets and satellites for commercial, government, and defense customers.
RKLB Technical Analysis Summary
Rocket Lab Corporation (RKLB) has entered a parabolic price discovery phase following a successful breakout from a multi-year rounding bottom. The stock is exhibiting extreme bullish momentum, trading well above its upper Bollinger Band, although the recent rejection near the $100 psychological level indicates some selling pressure at highs. Long-term structure is decisively bullish with rising moving averages and a positive MACD regime, but the significant extension from the mean suggests high volatility ahead.
Included In Lists
Related Tickers of Interest
RKLB Monthly Chart
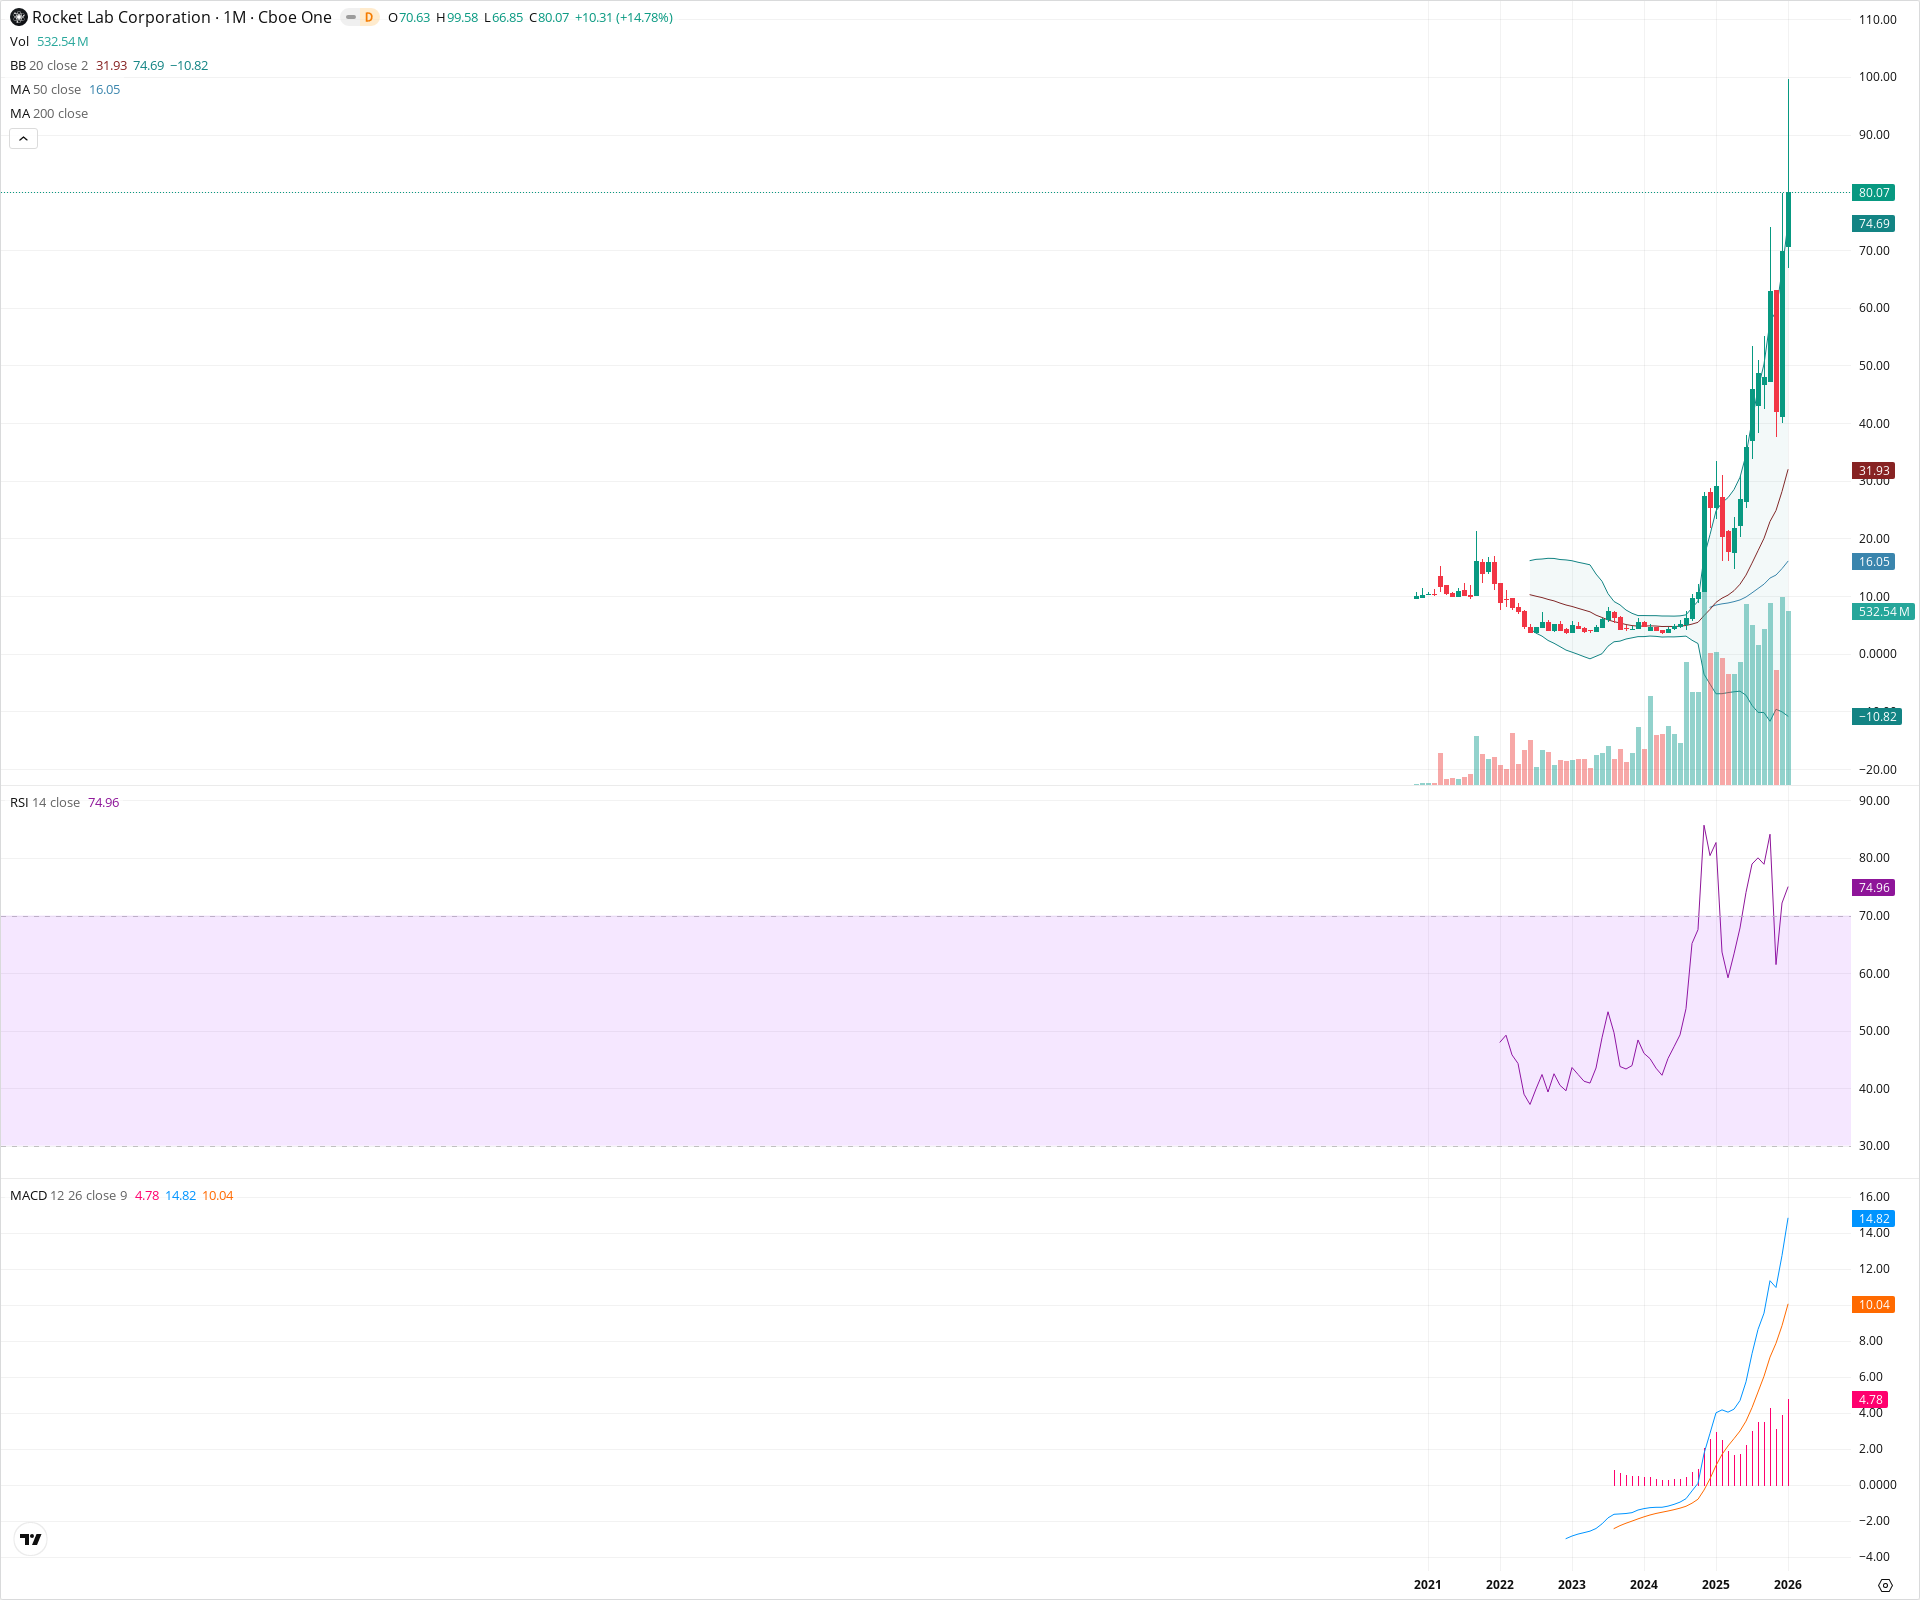
Sentiment
Short-term Sentiment (days to weeks): Bullish
Price is in an extreme vertical uptrend with RSI at 74.96 indicating strong momentum, though the long upper wick and rejection from $100 suggest potential for near-term volatility or profit-taking.
Long-term Sentiment (weeks to months): Bullish
The chart shows a confirmed breakout from a multi-year rounding bottom base. Moving averages (20 and 50 SMA) are trending steeply upward, and the MACD histogram shows expanding bullish momentum.
Report Metadata
- Timeframe: monthly
- Generated at: 2026-02-02T06:55:21.635Z
- Model: gemini-3-pro-preview
Support Price Levels
| Level | Range | Strength | Notes |
|---|---|---|---|
| $31.00 | $30.00 - $32.00 | Weak | Aligns with the rising 20-month SMA and the consolidation zone prior to the most recent vertical thrust. |
| $21.00 | $20.00 - $22.00 | Strong | Former structural resistance from 2021 highs, now a potential major polarity support level. |
| $5.80 | $3.60 - $8.00 | Strong | The secular floor established by the multi-year rounding bottom base structure. |
Resistance Price Levels
| Level | Range | Strength | Notes |
|---|---|---|---|
| $99.79 | $99.58 - $100.00 | Strong | Current all-time high and psychological round number resistance where price was recently rejected. |
Potential Chart Patterns in Formation
| Strength | Pattern | Signal | Target | Details |
|---|---|---|---|---|
| Strong | Rounding Bottom | Bullish | N/A | A multi-year accumulation phase from 2022 through 2024 that transitioned into a steady uptrend and eventual parabolic breakout. |
| Strong | Parabolic Advance | Bullish | N/A | Price has gone vertical in 2025-2026, detaching significantly from moving averages. |
Frequently Asked Questions about RKLB
What is the current sentiment for RKLB?
The short-term sentiment for RKLB is currently Bullish because Price is in an extreme vertical uptrend with RSI at 74.96 indicating strong momentum, though the long upper wick and rejection from $100 suggest potential for near-term volatility or profit-taking.. The long-term trend is classified as Bullish.
What are the key support levels for RKLB?
StockDips.AI has identified key support levels for RKLB at $31.00 and $21.00. These levels may represent potential accumulation zones where buying interest could emerge.
Is RKLB in a significant dip or a Value Dip right now?
RKLB has a Value Score of 68/100. It is not currently flagged as a significant dip in the Top Dips list. It is not listed as a Value Dip because the long-term sentiment or value-score threshold does not qualify.
View the full interactive analysis on StockDips.AI.