SHOP Weekly Technical Analysis
Shopify Inc
Provides e-commerce tools and payment solutions for online businesses.
SHOP Technical Analysis Summary
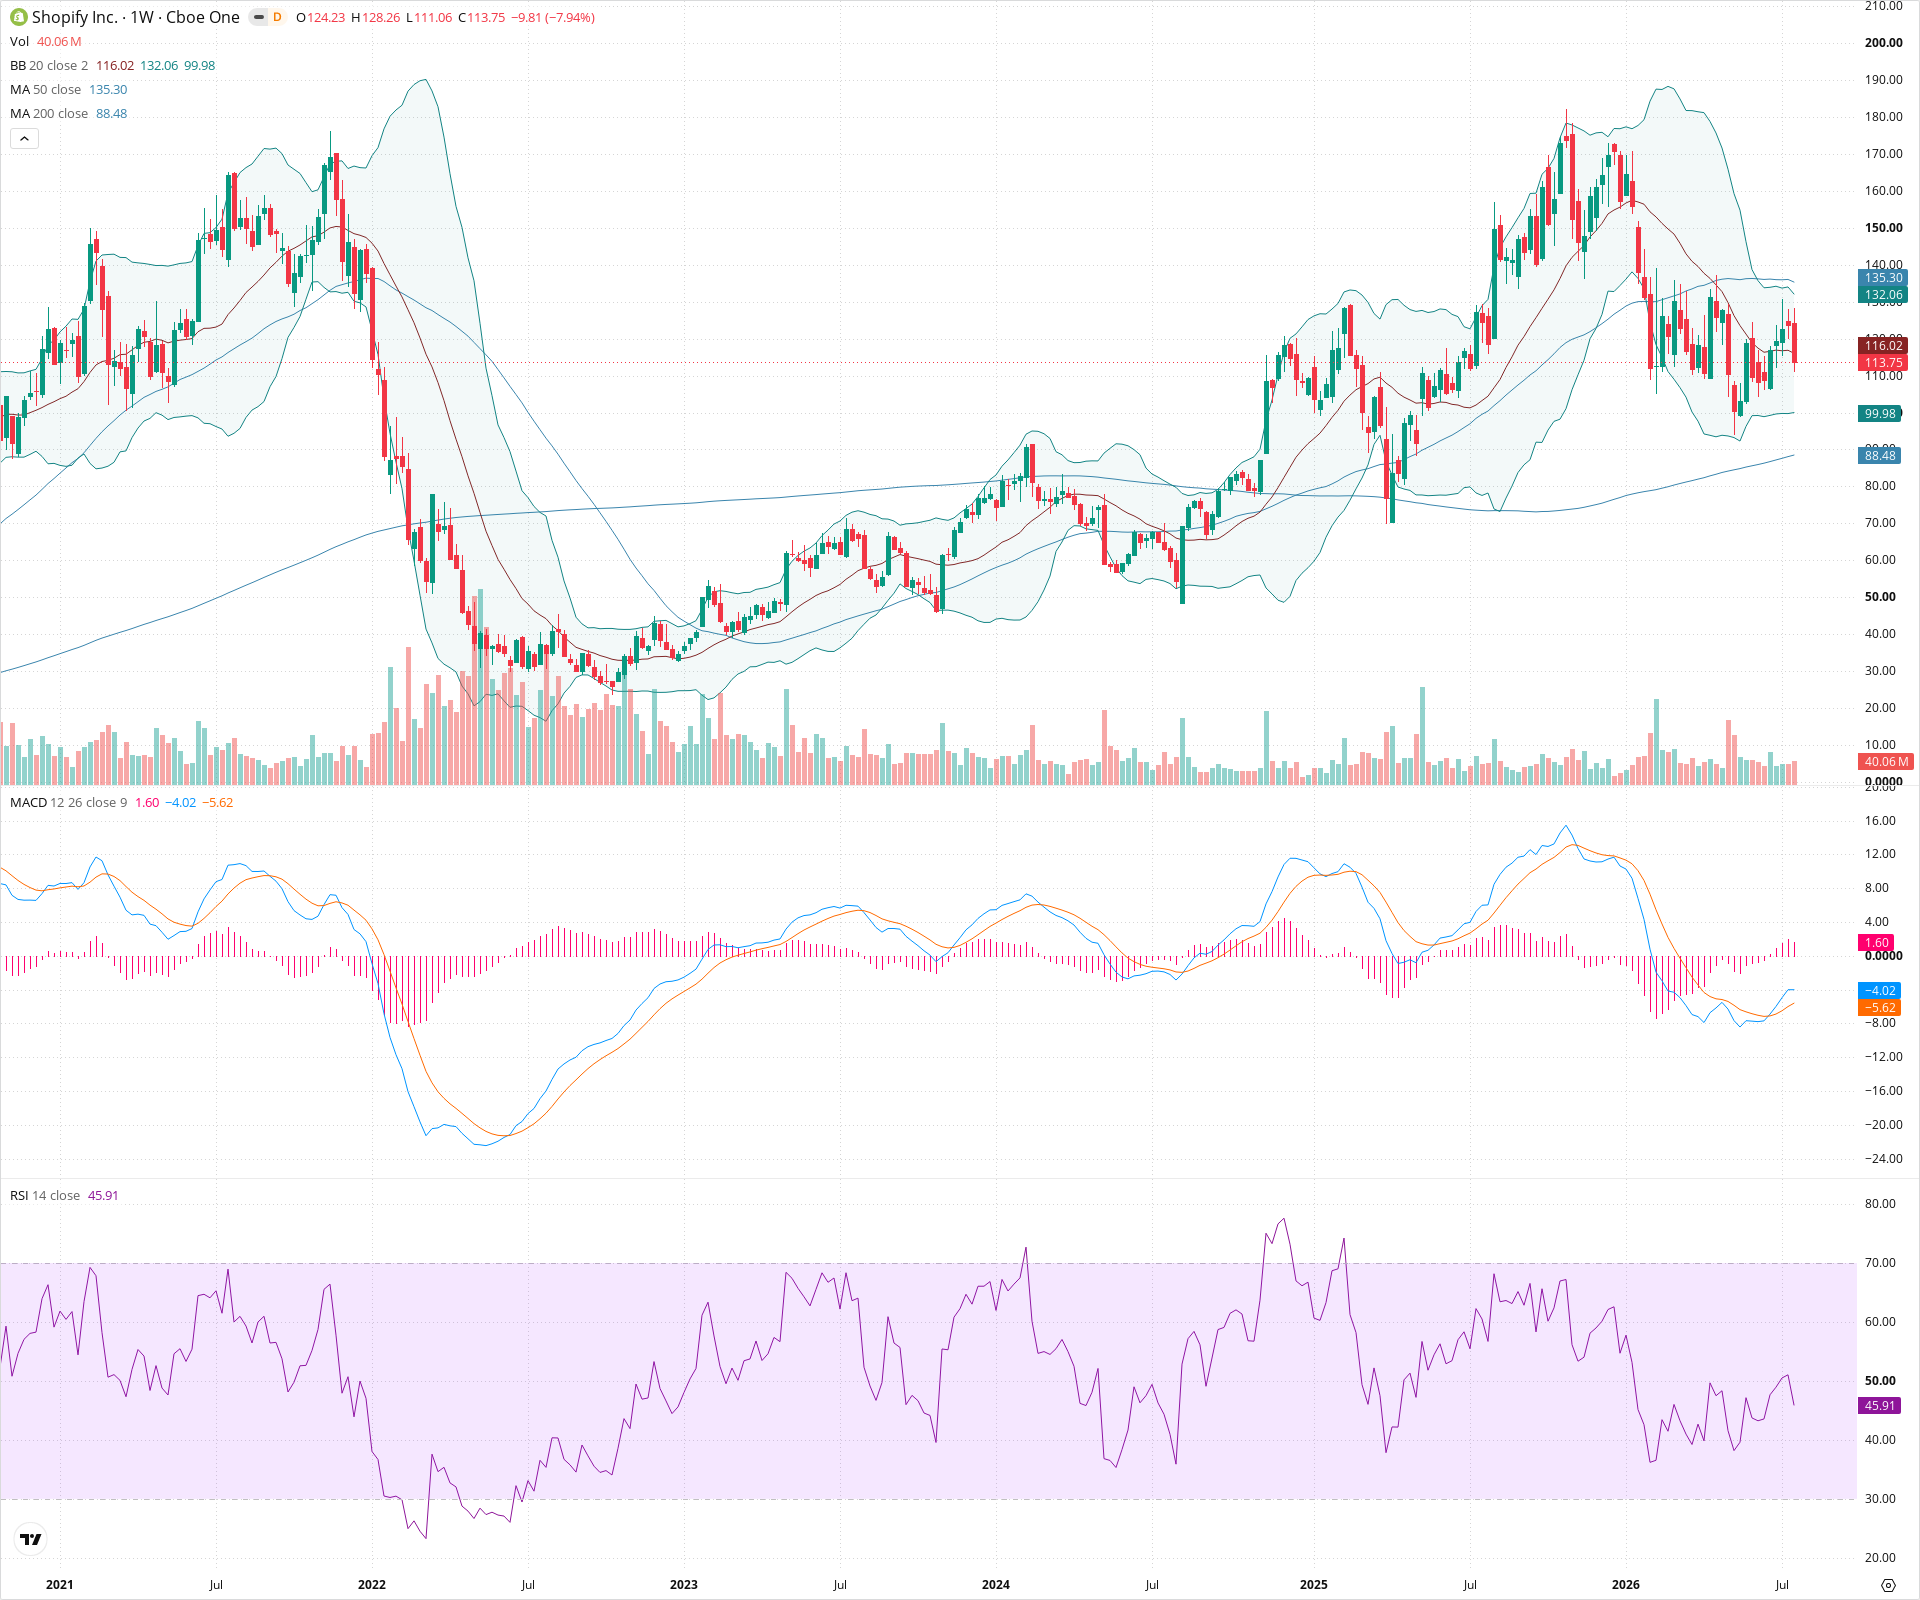
SHOP is currently exhibiting significant short-term weakness, forming a potential large topping structure on the weekly chart. The price is aggressively testing a critical support zone around 110-115, which acts as the neckline for this formation. While long-term sentiment remains somewhat anchored by the rising 200-week SMA below, a definitive weekly close below current support would likely confirm the top and trigger a deeper structural correction.
Included In Lists
Related Tickers of Interest
SHOP Weekly Chart
Sentiment
Short-term Sentiment (days to weeks): Bearish
Price is declining sharply below both the 20-week and 50-week SMAs. The MACD histogram is expanding negatively below the zero line, and RSI is trending downwards below 50, indicating strong bearish momentum.
Long-term Sentiment (weeks to months): Neutral
While short-term action is highly bearish, the price remains above the rising 200-week SMA (currently near 88). A large structural top may be forming, placing the broader uptrend in jeopardy depending on how current support levels hold.
Report Metadata
- Timeframe: weekly
- Generated at: 2026-07-25T09:05:19.999Z
- Model: gemini-3.1-pro-preview
Support Price Levels
| Level | Range | Strength | Notes |
|---|---|---|---|
| $110.00 | $105.00 - $115.00 | Strong | Critical support zone acting as the neckline of a potential large topping pattern. Represents recent major swing lows. |
| $90.00 | $85.00 - $95.00 | Strong | Confluence of prior multi-month consolidation and the currently rising 200-week SMA. |
Resistance Price Levels
| Level | Range | Strength | Notes |
|---|---|---|---|
| $138.50 | $132.00 - $145.00 | Strong | Zone defined by the recent lower swing high and the cluster of the declining 20-week and 50-week SMAs. |
| $177.50 | $170.00 - $185.00 | Strong | Major structural peak and absolute high on the visible chart. |
Potential Chart Patterns in Formation
| Strength | Pattern | Signal | Target | Details |
|---|---|---|---|---|
| Strong | Head and Shoulders Top (Potential) | Bearish | N/A | A large topping structure appears to be forming with a head peak near 180 and a right shoulder near 145. The price is currently aggressively testing the neckline support around 110-115. |
Frequently Asked Questions about SHOP
What is the current sentiment for SHOP?
The short-term sentiment for SHOP is currently Bearish because Price is declining sharply below both the 20-week and 50-week SMAs. The MACD histogram is expanding negatively below the zero line, and RSI is trending downwards below 50, indicating strong bearish momentum.. The long-term trend is classified as Neutral.
What are the key support levels for SHOP?
StockDips.AI has identified key support levels for SHOP at $110.00 and $90.00. These levels may represent potential accumulation zones where buying interest could emerge.
Is SHOP in a significant dip or a Value Dip right now?
SHOP has a Value Score of 69/100. It is not currently flagged as a significant dip in the Top Dips list. It is not listed as a Value Dip because the long-term sentiment or value-score threshold does not qualify.
View the full interactive analysis on StockDips.AI.