SHOP Monthly Technical Analysis
Shopify Inc
Provides e-commerce tools and payment solutions for online businesses.
SHOP Technical Analysis Summary
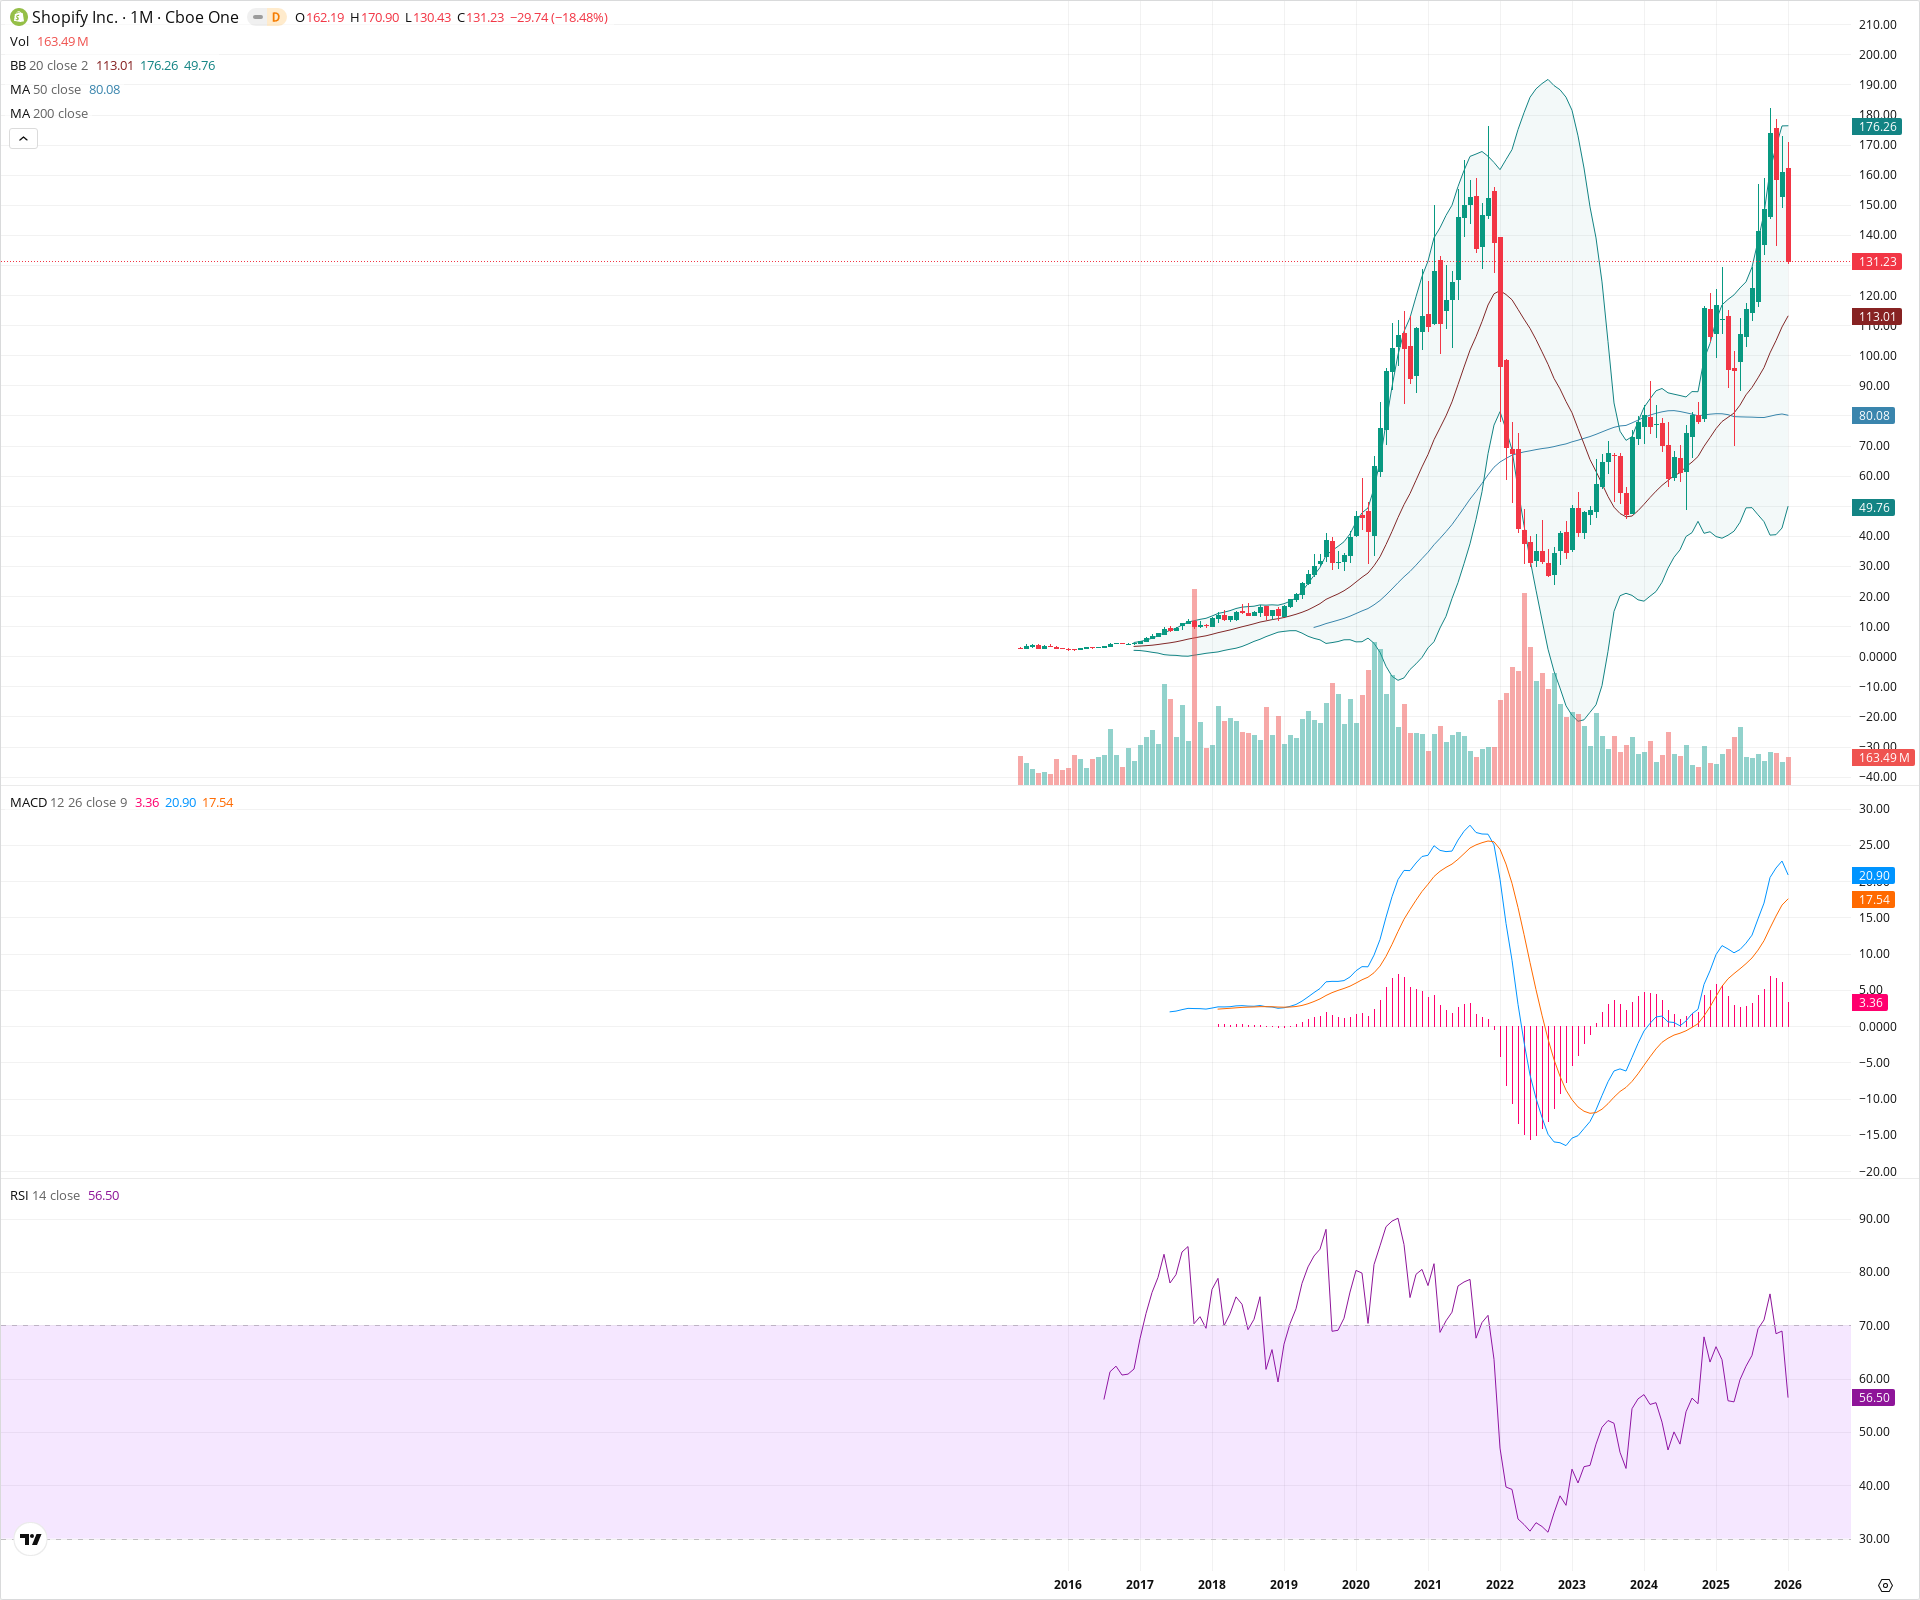
Shopify has completed a significant structural recovery, returning to test its 2021 all-time highs near 176, where it is currently facing strong rejection. While the long-term trend remains constructive with price above key moving averages and positive MACD momentum, the immediate sharp pullback suggests a period of consolidation or handle formation may be required before a successful breakout can occur. Investors should watch the interaction with the 20-month SMA at 113 for signs of trend continuation versus a deeper correction.
Included In Lists
Related Tickers of Interest
SHOP Monthly Chart
Sentiment
Short-term Sentiment (days to weeks): Bearish
The current monthly candle is a large red bar showing an 18% decline, signaling a sharp rejection from major secular resistance near the all-time highs.
Long-term Sentiment (weeks to months): Bullish
The stock has established a strong multi-year recovery trend since 2022, forming a large base and trading well above its rising 20-month and 50-month moving averages.
Report Metadata
- Timeframe: monthly
- Generated at: 2026-02-02T06:55:07.410Z
- Model: gemini-3-pro-preview
Support Price Levels
| Level | Range | Strength | Notes |
|---|---|---|---|
| $113.01 | $113.01 - $113.01 | Strong | Coincides with the 20-month SMA (Bollinger Band basis), acting as the primary dynamic support for the uptrend. |
| $85.04 | $80.08 - $90.00 | Strong | Convergence of the 50-month SMA and previous consolidation zones. |
| $52.38 | $49.76 - $55.00 | Weak | Lower Bollinger Band area and deep structural support from 2023 base. |
Resistance Price Levels
| Level | Range | Strength | Notes |
|---|---|---|---|
| $162.50 | $160.00 - $165.00 | Weak | Intra-month volatility resistance level prior to the final peak test. |
| $173.58 | $170.90 - $176.26 | Strong | Major resistance zone defined by the current month's high, the upper Bollinger Band, and the 2021 all-time highs. |
Potential Chart Patterns in Formation
| Strength | Pattern | Signal | Target | Details |
|---|---|---|---|---|
| Strong | Rounding Bottom / Cup | Bullish | N/A | A massive multi-year U-shaped recovery from the 2022 lows back to the 2021 highs. |
| Weak | Potential Double Top | Bearish | N/A | Price is currently revisiting the 2021 all-time high area and reacting with a sharp rejection, threatening a double top if the breakout fails. |
Frequently Asked Questions about SHOP
What is the current sentiment for SHOP?
The short-term sentiment for SHOP is currently Bearish because The current monthly candle is a large red bar showing an 18% decline, signaling a sharp rejection from major secular resistance near the all-time highs.. The long-term trend is classified as Bullish.
What are the key support levels for SHOP?
StockDips.AI has identified key support levels for SHOP at $113.01 and $85.04. These levels may represent potential accumulation zones where buying interest could emerge.
Is SHOP in a significant dip or a Value Dip right now?
SHOP has a Value Score of 69/100. It is not currently flagged as a significant dip in the Top Dips list. It is not listed as a Value Dip because the long-term sentiment or value-score threshold does not qualify.
View the full interactive analysis on StockDips.AI.