SNDK Monthly Technical Analysis
SanDisk Corp
Designs and manufactures flash memory products and solutions, including solid-state drives (SSDs), memory cards, and USB flash drives. The company develops products for a wide range of applications, from consumer electronics to high-growth data centers and AI computing.
SNDK Technical Analysis Summary
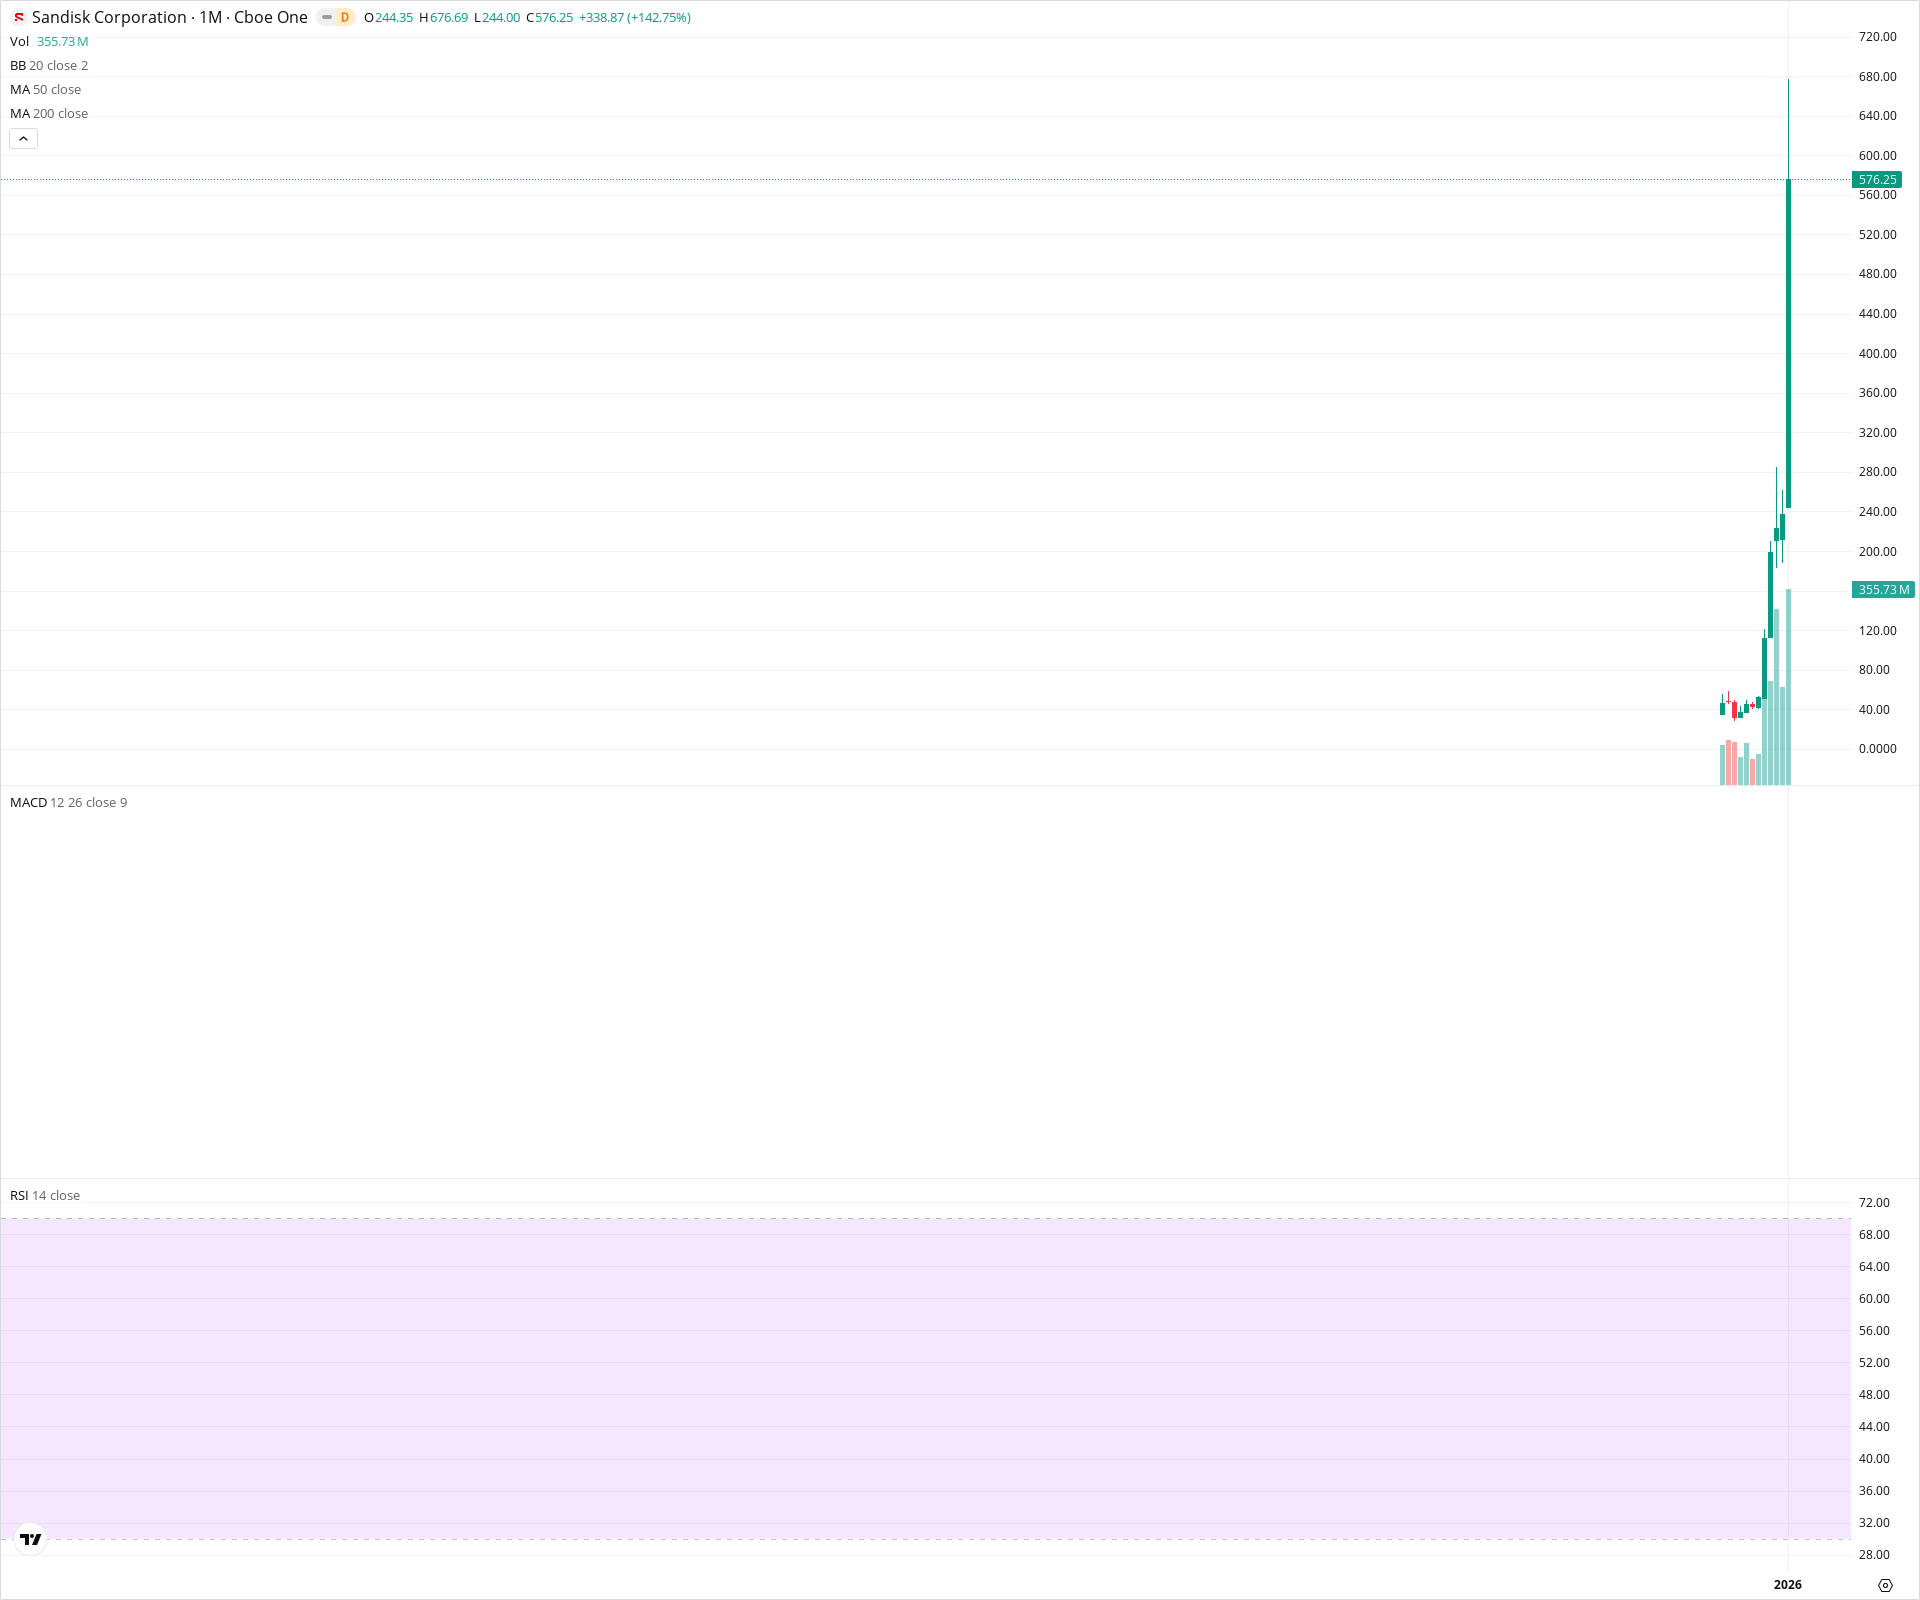
Sandisk Corporation is exhibiting an extreme parabolic breakout, with the current monthly candle showing a gain of over 140% on high volume. This move marks a definitive departure from a multi-year consolidation base below 135, placing the stock in price discovery mode. While the trend is overwhelmingly bullish, the vertical nature of the ascent suggests high volatility, with the only immediate resistance being the recent wick high at 676.69. Support is established far below at the candle's open of 244.00.
Included In Lists
Related Tickers of Interest
SNDK Monthly Chart
Sentiment
Short-term Sentiment (days to weeks): Bullish
The price is in an extreme vertical uptrend, gaining over 142% in the current month alone with massive volume support.
Long-term Sentiment (weeks to months): Bullish
The stock has decisively broken out of a multi-year consolidation base, establishing a new bullish regime well above all moving averages.
Report Metadata
- Timeframe: monthly
- Generated at: 2026-02-02T06:57:41.611Z
- Model: gemini-3-pro-preview
Support Price Levels
| Level | Range | Strength | Notes |
|---|---|---|---|
| $247.00 | $244.00 - $250.00 | Strong | The open of the current massive impulsive candle; acts as the immediate floor for the parabolic move. |
| $127.50 | $120.00 - $135.00 | Strong | Upper boundary of the previous multi-year consolidation zone/breakout point. |
| $90.00 | $80.00 - $100.00 | Weak | Historical base of the consolidation range. |
Resistance Price Levels
| Level | Range | Strength | Notes |
|---|---|---|---|
| $676.50 | $676.00 - $677.00 | Weak | The all-time high set by the wick of the current monthly candle. |
Potential Chart Patterns in Formation
| Strength | Pattern | Signal | Target | Details |
|---|---|---|---|---|
| Strong | Parabolic Breakout | Bullish | N/A | Price has moved vertically from the ~240 level to ~676 in a single month, signaling extreme momentum. |
| Strong | Base Breakout | Bullish | N/A | Clear exit from a long-term horizontal trading range between 80 and 130. |
Frequently Asked Questions about SNDK
What is the current sentiment for SNDK?
The short-term sentiment for SNDK is currently Bullish because The price is in an extreme vertical uptrend, gaining over 142% in the current month alone with massive volume support.. The long-term trend is classified as Bullish.
What are the key support levels for SNDK?
StockDips.AI has identified key support levels for SNDK at $247.00 and $127.50. These levels may represent potential accumulation zones where buying interest could emerge.
Is SNDK in a significant dip or a Value Dip right now?
SNDK has a Value Score of 55/100. It is not currently flagged as a significant dip in the Top Dips list. It is not listed as a Value Dip because the long-term sentiment or value-score threshold does not qualify.
View the full interactive analysis on StockDips.AI.