TSLA Monthly Technical Analysis
Tesla Inc
Electric vehicle and clean energy company known for innovation and global EV leadership.
TSLA Technical Analysis Summary
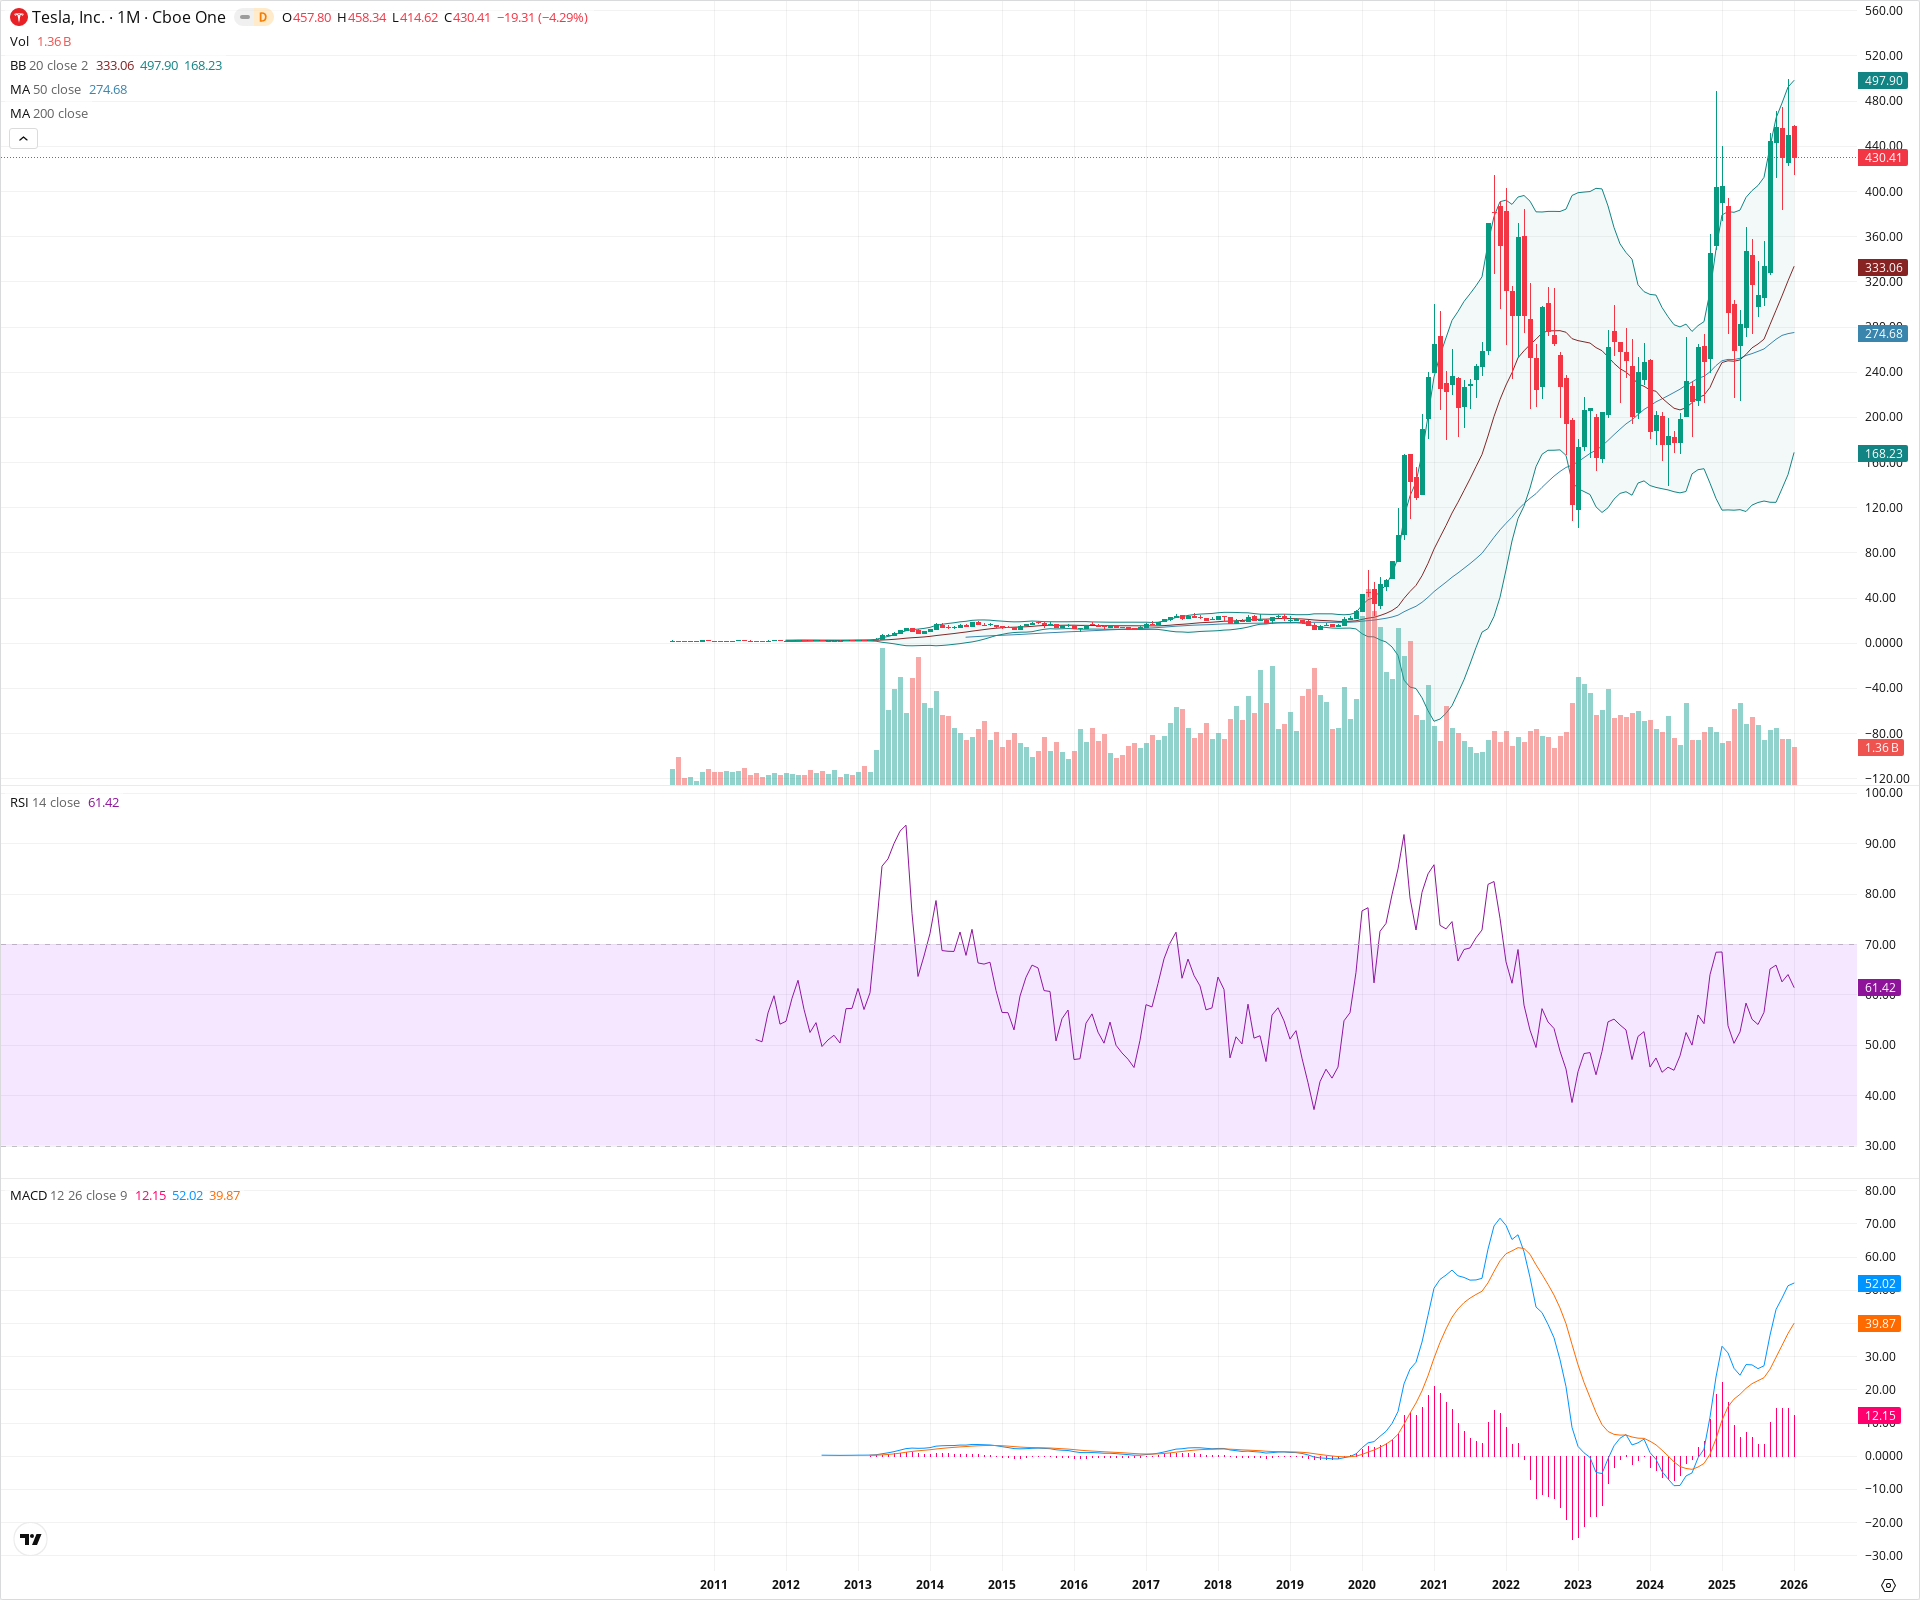
TSLA has firmly re-entered a long-term bullish phase by breaking out of a 3-year consolidation pattern to set new all-time highs. The alignment of moving averages and a rising MACD supports a sustained uptrend, with the upper Bollinger Band suggesting room toward 500. Investors should watch the 400-415 zone closely, as the current pullback is testing this level as new support.
Included In Lists
Related Tickers of Interest
TSLA Monthly Chart
Sentiment
Short-term Sentiment (days to weeks): Bullish
Price recently broke out to new all-time highs. The current monthly candle represents a technical pullback/retest of the breakout level (approx. 415) rather than a trend reversal.
Long-term Sentiment (weeks to months): Bullish
The stock has resumed its secular uptrend after a multi-year consolidation. Price is well above rising 20 and 50-month SMAs, and the MACD has expanded into positive territory, confirming a new bull regime.
Report Metadata
- Timeframe: monthly
- Generated at: 2026-02-02T06:58:45.310Z
- Model: gemini-3-pro-preview
Support Price Levels
| Level | Range | Strength | Notes |
|---|---|---|---|
| $407.50 | $400.00 - $415.00 | Strong | Former all-time high resistance from 2021, now acting as a major polarity support zone (currently being tested). |
| $332.50 | $330.00 - $335.00 | Strong | Confluence of the 20-month SMA basis and previous consolidation highs. |
| $272.50 | $270.00 - $275.00 | Weak | 50-month SMA providing deep structural support. |
Resistance Price Levels
| Level | Range | Strength | Notes |
|---|---|---|---|
| $459.00 | $458.00 - $460.00 | Weak | Current month's high and the new all-time high peak. |
| $497.50 | $495.00 - $500.00 | Strong | Upper Bollinger Band location and psychological round number resistance. |
Potential Chart Patterns in Formation
| Strength | Pattern | Signal | Target | Details |
|---|---|---|---|---|
| Strong | Multi-Year Consolidation Breakout | Bullish | N/A | Price consolidated from late 2021 through mid-2024 before breaking out above the ~415 level. This indicates a continuation of the primary secular trend. |
Frequently Asked Questions about TSLA
What is the current sentiment for TSLA?
The short-term sentiment for TSLA is currently Bullish because Price recently broke out to new all-time highs. The current monthly candle represents a technical pullback/retest of the breakout level (approx. 415) rather than a trend reversal.. The long-term trend is classified as Bullish.
What are the key support levels for TSLA?
StockDips.AI has identified key support levels for TSLA at $407.50 and $332.50. These levels may represent potential accumulation zones where buying interest could emerge.
Is TSLA in a significant dip or a Value Dip right now?
TSLA has a Value Score of 74/100. It is currently flagged as a significant dip in the Top Dips list. It is also listed as a Value Dip because long-term sentiment is bullish.
View the full interactive analysis on StockDips.AI.