TSM Weekly Technical Analysis
Taiwan Semiconductor Manufacturing Co
World's largest semiconductor foundry manufacturing advanced chips for major tech firms.
TSM Technical Analysis Summary
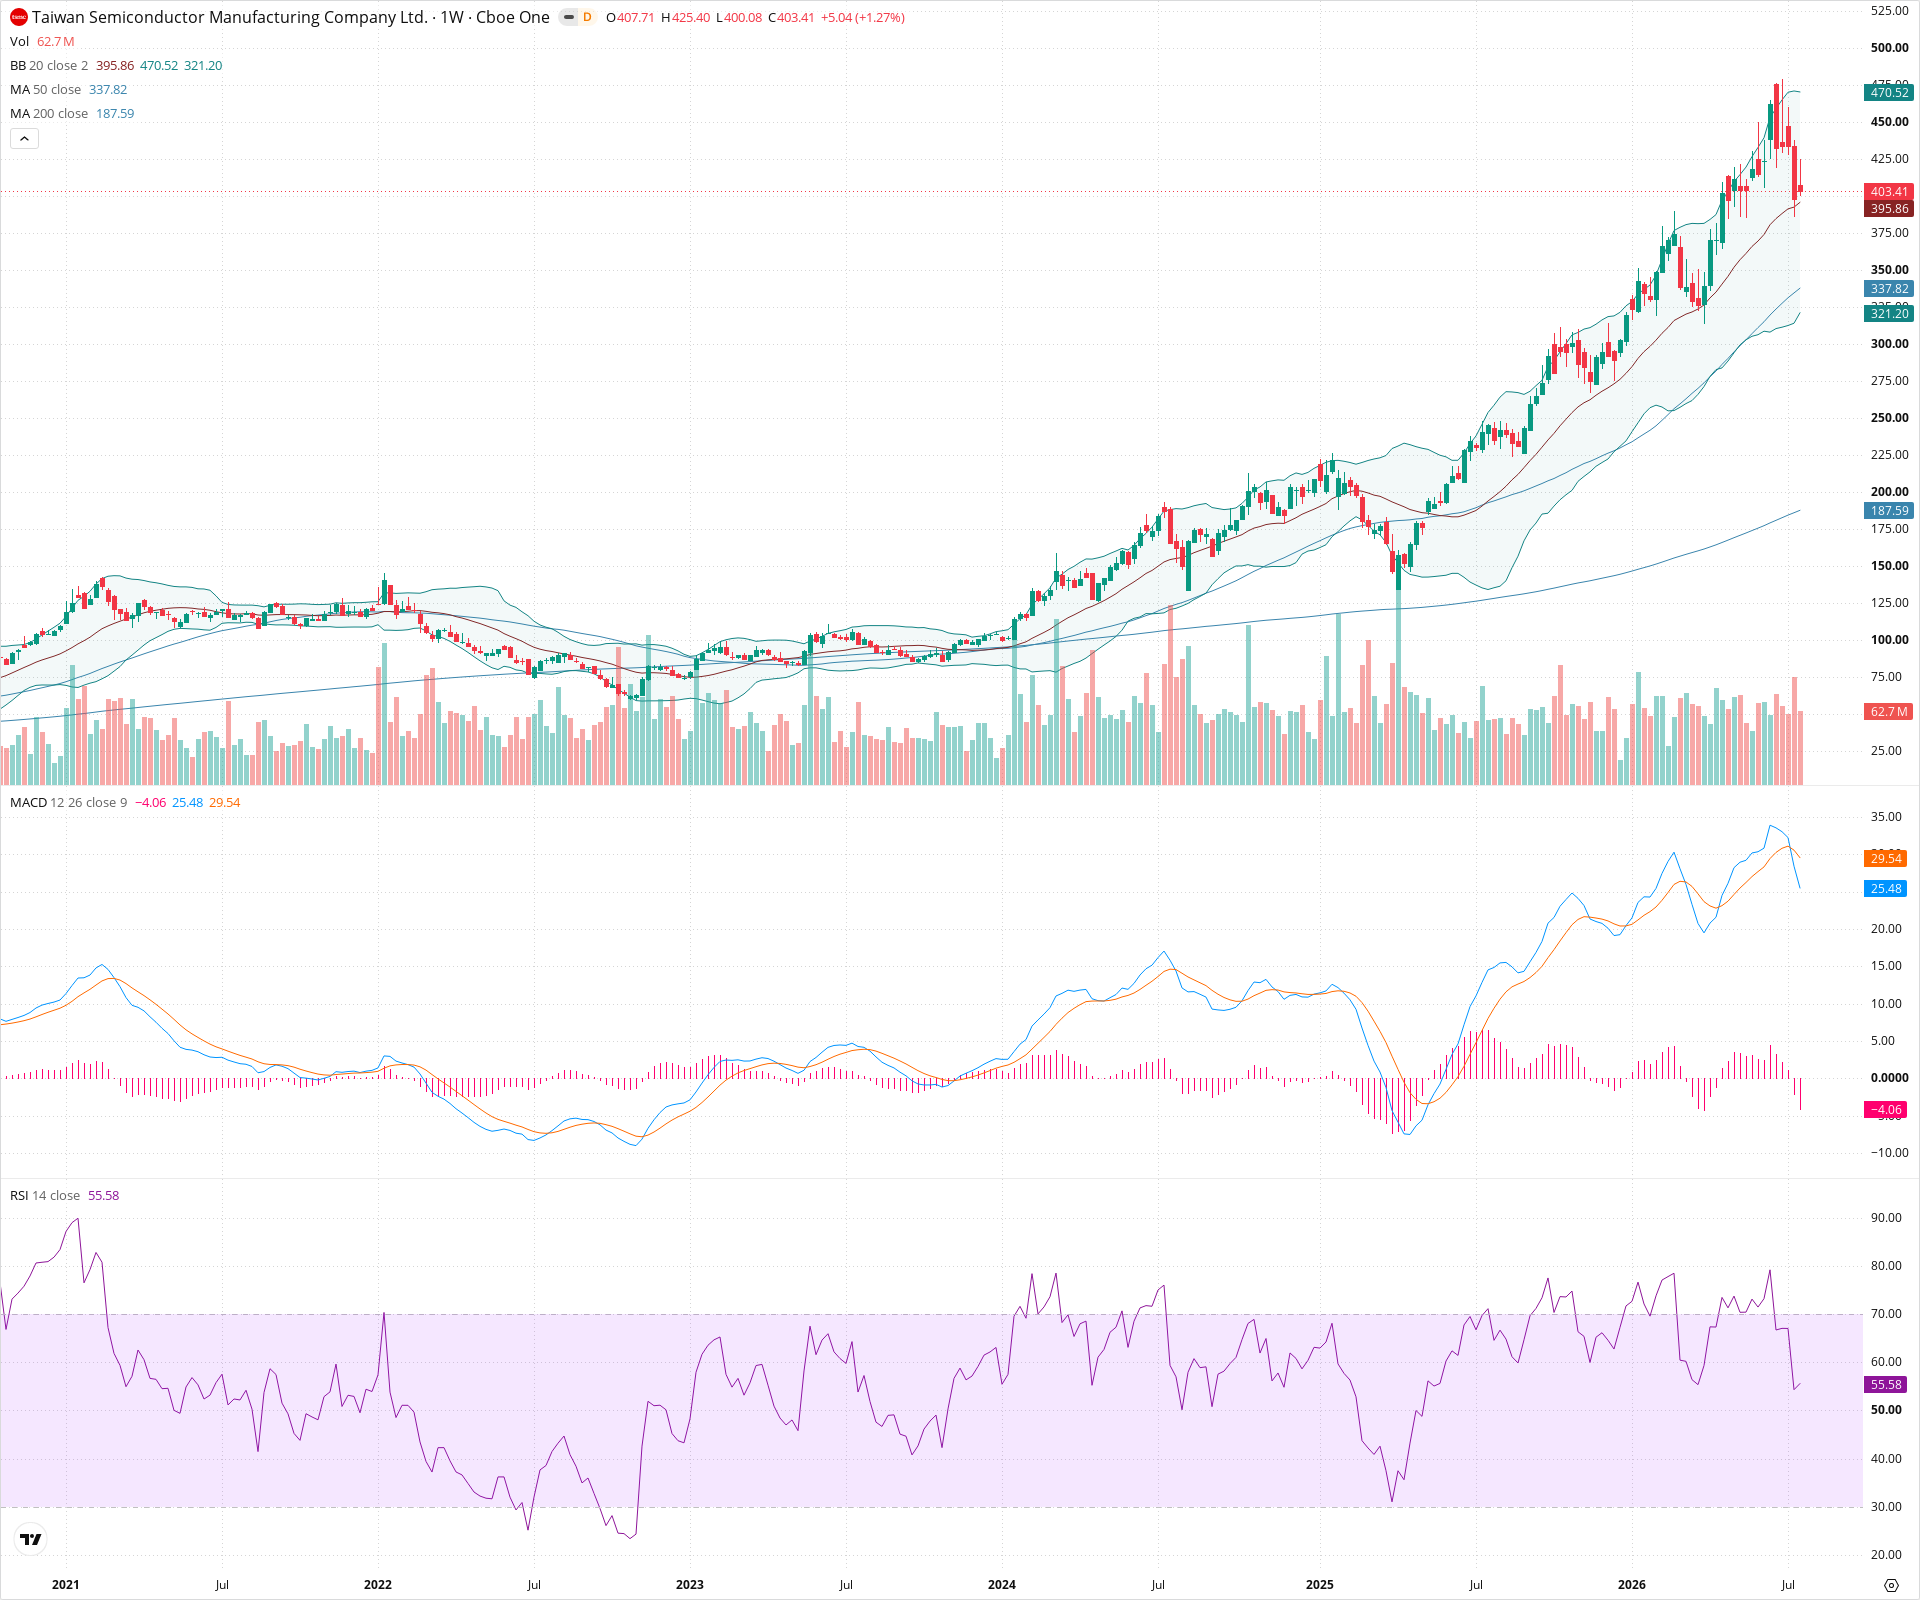
TSM is currently undergoing a sharp, fast-paced correction following a parabolic run to new all-time highs. Short-term momentum has definitively shifted bearish, evidenced by the weekly MACD crossover and falling RSI. However, the long-term trend remains firmly intact, and the current pullback is bringing the price back toward historical mean levels like the 50-week SMA. The immediate focus is whether the current test of the 20-week SMA around 395-400 will hold as support.
Included In Lists
Related Tickers of Interest
TSM Weekly Chart
Sentiment
Short-term Sentiment (days to weeks): Bearish
The stock has experienced a sharp, multi-week pullback from all-time highs. This is accompanied by a bearish MACD crossover, negative histogram expansion, and a steeply falling RSI.
Long-term Sentiment (weeks to months): Bullish
Despite the recent sharp correction, the macro structure remains in a clear uptrend. Price is holding well above the rising 50-week and 200-week SMAs.
Report Metadata
- Timeframe: weekly
- Generated at: 2026-07-25T09:02:35.699Z
- Model: gemini-3.1-pro-preview
Support Price Levels
| Level | Range | Strength | Notes |
|---|---|---|---|
| $400.00 | $395.00 - $405.00 | Strong | Current test zone coinciding with the 20-week SMA (middle Bollinger Band) and psychological 400 level. |
| $337.50 | $330.00 - $345.00 | Strong | Zone around the rising 50-week SMA, which served as dynamic support in the past. |
| $287.50 | $275.00 - $300.00 | Strong | Major structural support from previous swing highs prior to the final parabolic advance. |
Resistance Price Levels
| Level | Range | Strength | Notes |
|---|---|---|---|
| $470.00 | $465.00 - $475.00 | Weak | Resistance near the current upper Bollinger Band. |
| $512.50 | $500.00 - $525.00 | Strong | Recent all-time high zone where significant selling pressure originated. |
Potential Chart Patterns in Formation
| Strength | Pattern | Signal | Target | Details |
|---|---|---|---|---|
| Strong | Parabolic Trend Breakdown | Bearish | $340.00 | The extraordinarily steep uptrend from late 2024 has broken down, resulting in a sharp mean-reversion correction towards major moving averages. |
Frequently Asked Questions about TSM
What is the current sentiment for TSM?
The short-term sentiment for TSM is currently Bearish because The stock has experienced a sharp, multi-week pullback from all-time highs. This is accompanied by a bearish MACD crossover, negative histogram expansion, and a steeply falling RSI.. The long-term trend is classified as Bullish.
What are the key support levels for TSM?
StockDips.AI has identified key support levels for TSM at $400.00 and $337.50. These levels may represent potential accumulation zones where buying interest could emerge.
Is TSM in a significant dip or a Value Dip right now?
TSM has a Value Score of 69/100. It is not currently flagged as a significant dip in the Top Dips list. It is not listed as a Value Dip because the long-term sentiment or value-score threshold does not qualify.
View the full interactive analysis on StockDips.AI.