TSM Monthly Technical Analysis
Taiwan Semiconductor Manufacturing Co
World's largest semiconductor foundry manufacturing advanced chips for major tech firms.
TSM Technical Analysis Summary
TSM is in a powerful secular bull market, having cleared multi-year resistance levels to enter a phase of price discovery. The moving averages are in perfect bullish alignment (20>50>200), and momentum indicators suggest the trend remains vigorous despite being historically extended. Long-term structural support is established far below at previous breakout levels, offering a substantial safety cushion for the secular thesis.
Included In Lists
Related Tickers of Interest
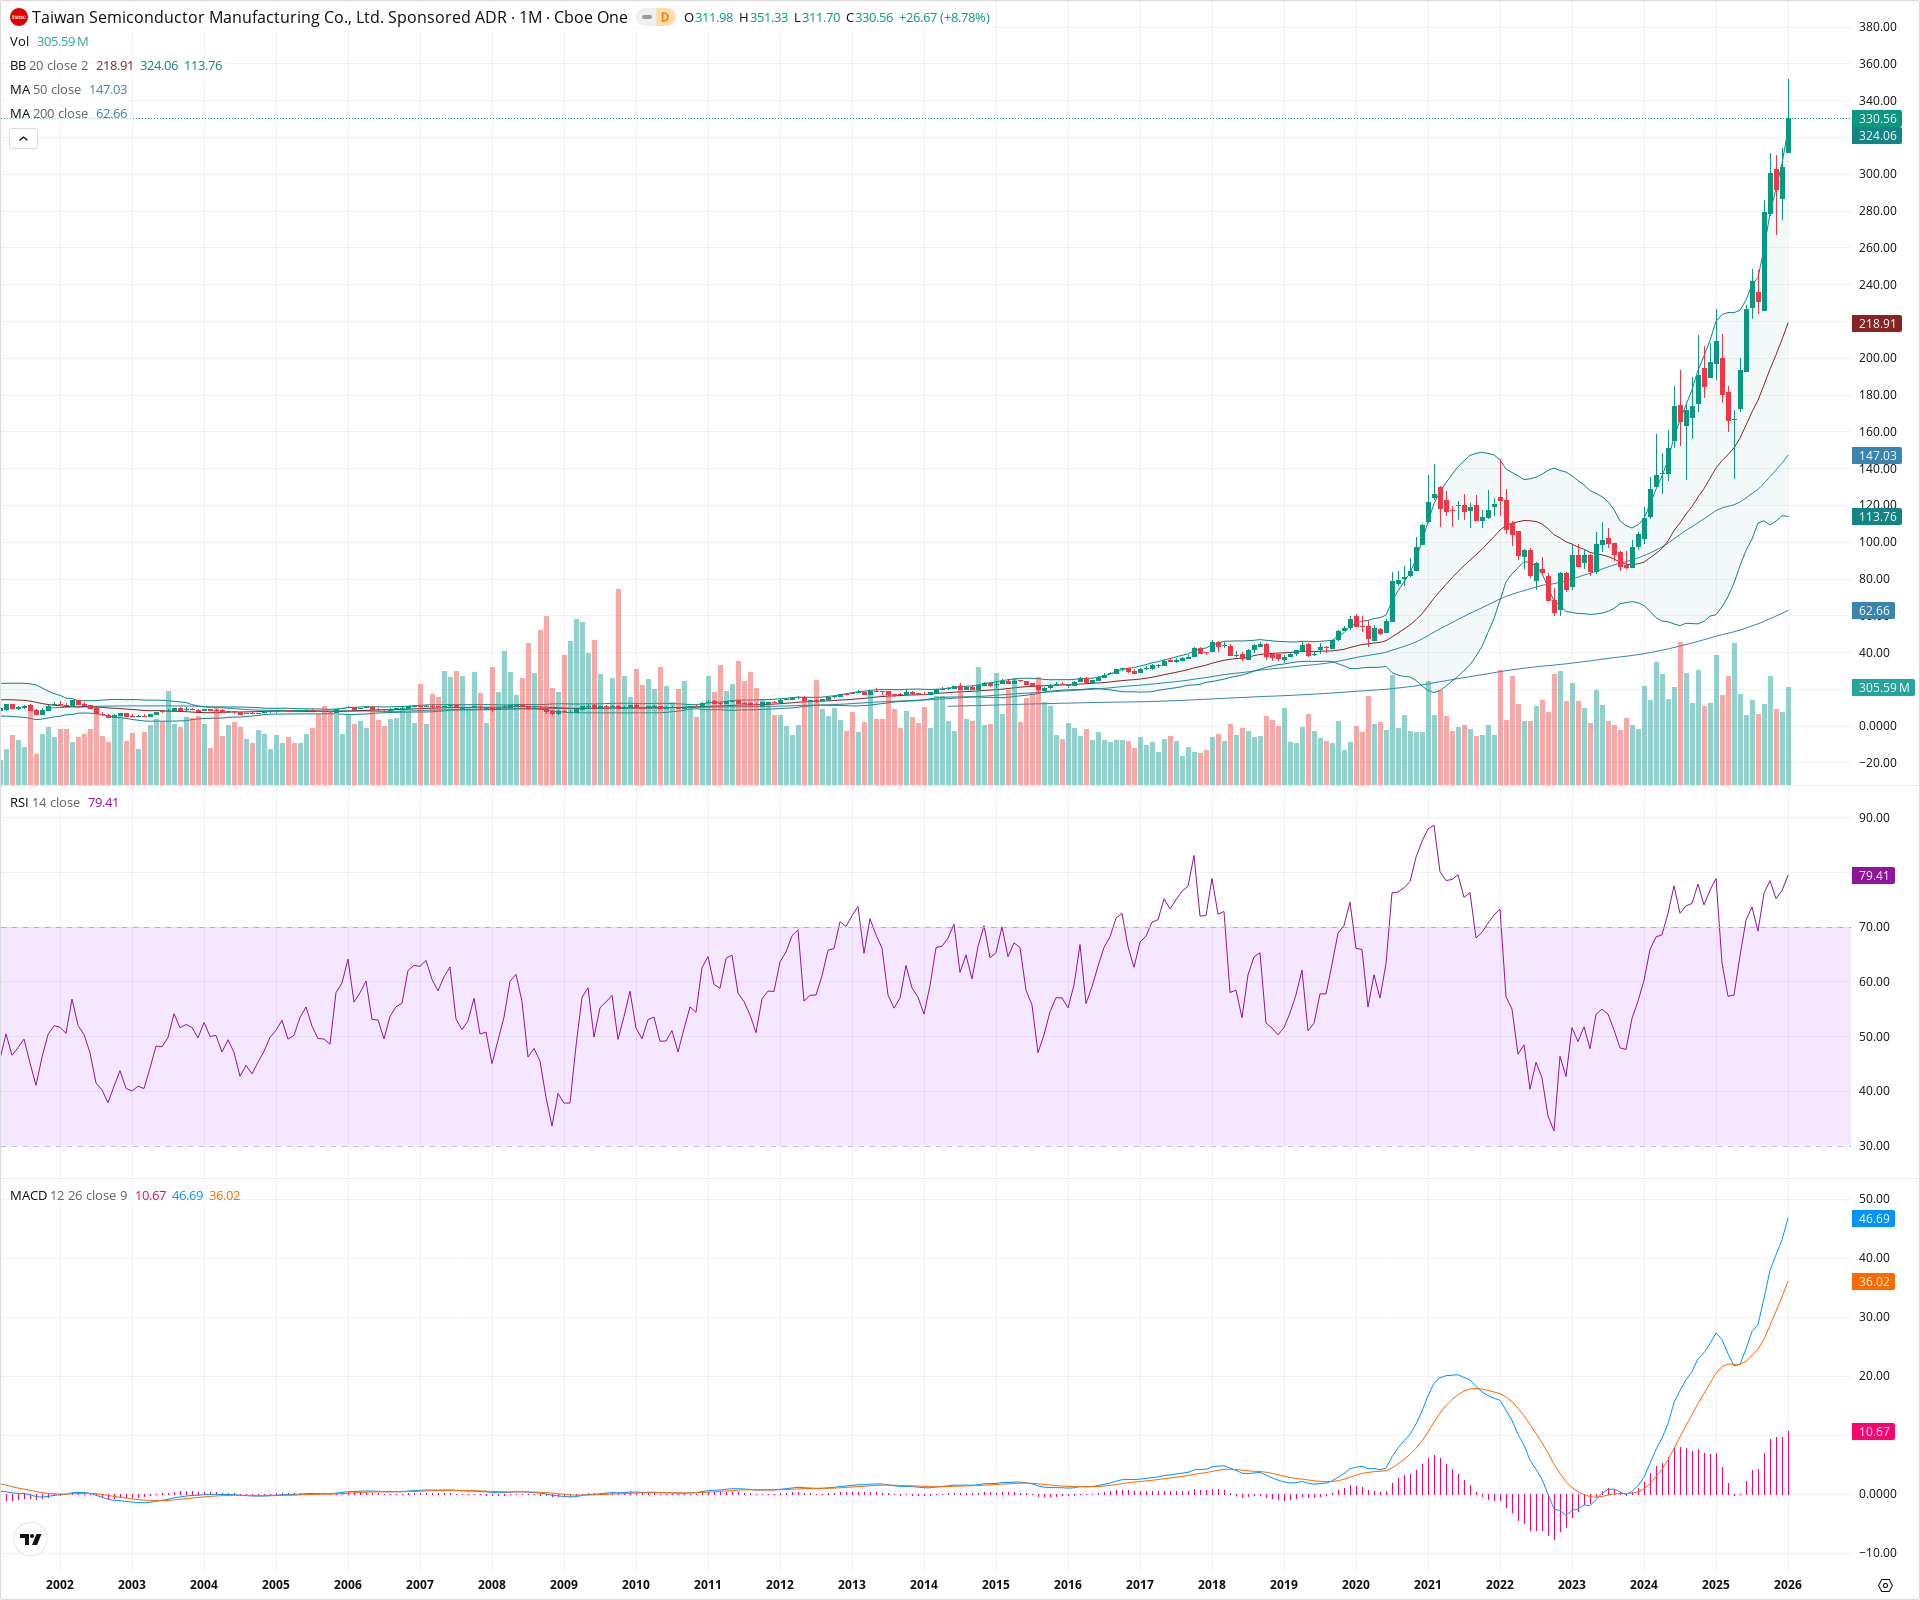
TSM Monthly Chart
Sentiment
Short-term Sentiment (days to weeks): Bullish
Price is in a vertical ascent, riding the upper Bollinger Band with the RSI at 79.41, indicating extremely strong momentum. The MACD histogram is expanding positively, confirming the trend's strength.
Long-term Sentiment (weeks to months): Bullish
The chart exhibits a classic secular bull regime with price well above rising 20, 50, and 200-month SMAs. The breakout from the 2021-2023 consolidation phase has been decisive and sustained.
Report Metadata
- Timeframe: monthly
- Generated at: 2026-02-02T06:59:08.568Z
- Model: gemini-3-pro-preview
Support Price Levels
| Level | Range | Strength | Notes |
|---|---|---|---|
| $221.50 | $218.00 - $225.00 | Strong | Aligns with the rising 20-month SMA (currently ~218.91), which serves as the dynamic support for the long-term trend. |
| $143.00 | $138.00 - $148.00 | Strong | Major structural support zone formed by the 2021/2022 highs; this level marks the breakout point of the previous multi-year base. |
Resistance Price Levels
| Level | Range | Strength | Notes |
|---|---|---|---|
| $351.50 | $351.00 - $352.00 | Weak | The immediate resistance is the all-time high established by the current monthly candle's wick. |
| $400.00 | $395.00 - $405.00 | Weak | Psychological round-number resistance as the stock trades in price discovery mode without historical overhead. |
Potential Chart Patterns in Formation
| Strength | Pattern | Signal | Target | Details |
|---|---|---|---|---|
| Strong | Secular Breakout | Bullish | N/A | A successful breakout from a multi-year consolidation period (approx. 2021-2023) capped around the 140-145 level, leading to the current parabolic advance. |
Frequently Asked Questions about TSM
What is the current sentiment for TSM?
The short-term sentiment for TSM is currently Bullish because Price is in a vertical ascent, riding the upper Bollinger Band with the RSI at 79.41, indicating extremely strong momentum. The MACD histogram is expanding positively, confirming the trend's strength.. The long-term trend is classified as Bullish.
What are the key support levels for TSM?
StockDips.AI has identified key support levels for TSM at $221.50 and $143.00. These levels may represent potential accumulation zones where buying interest could emerge.
Is TSM in a significant dip or a Value Dip right now?
TSM has a Value Score of 69/100. It is not currently flagged as a significant dip in the Top Dips list. It is not listed as a Value Dip because the long-term sentiment or value-score threshold does not qualify.
View the full interactive analysis on StockDips.AI.