JPM Daily Technical Analysis
JPMorgan Chase & Co.
Largest U.S. bank providing consumer, corporate, and investment banking services.
JPM Technical Analysis Summary
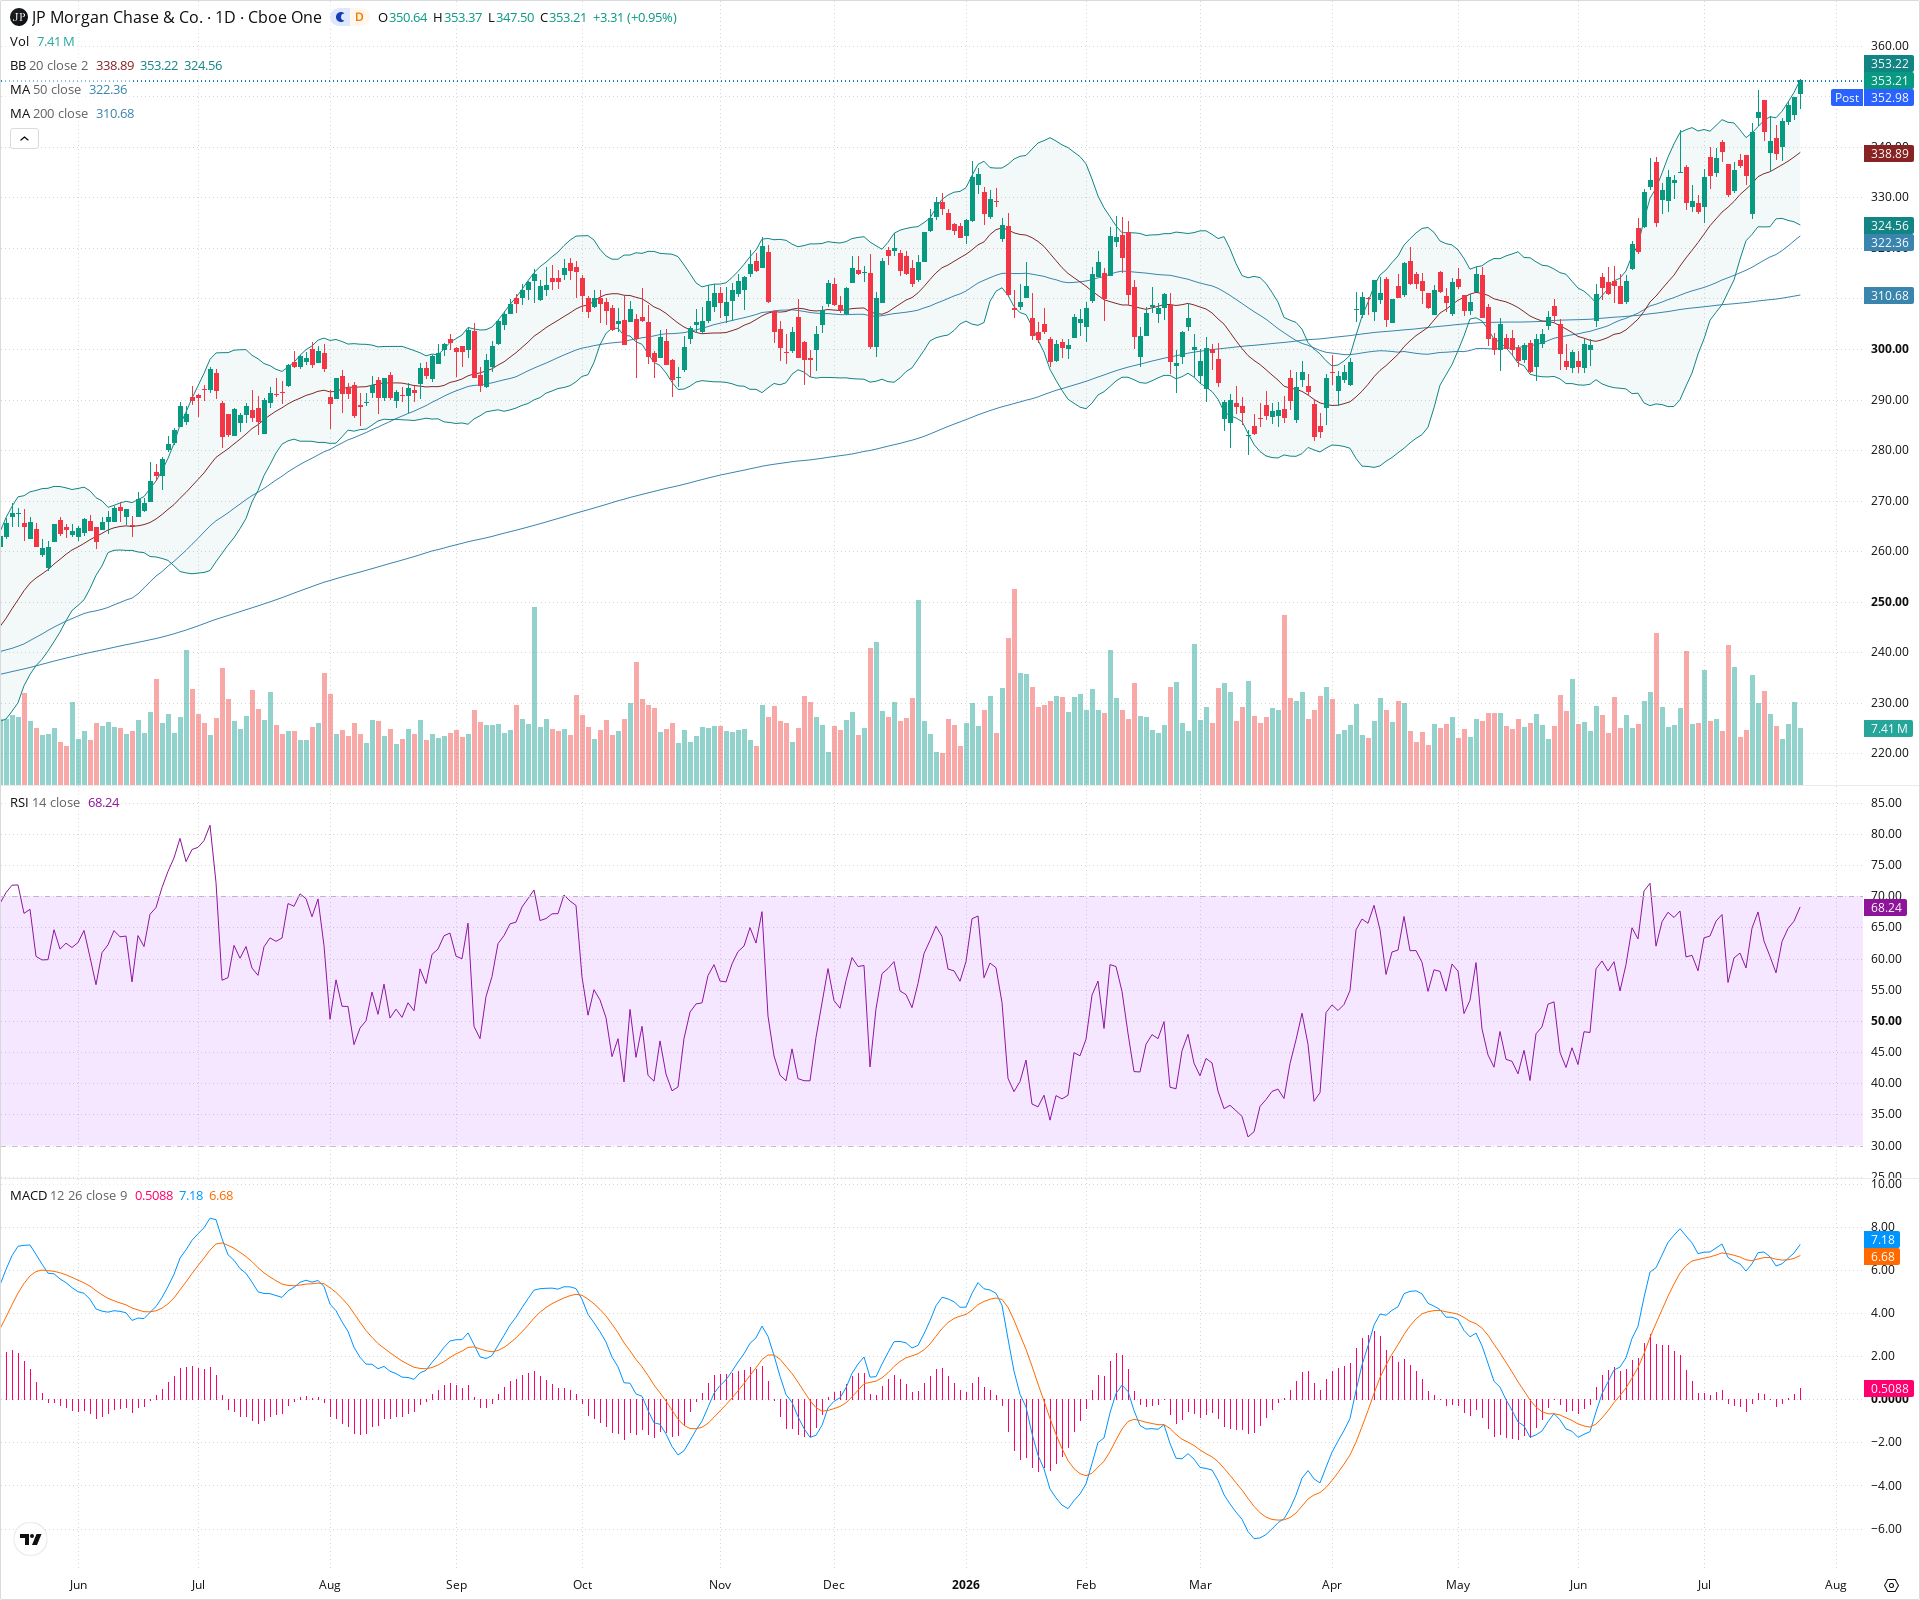
JPM is exhibiting strong bullish momentum across both short and long-term timeframes. The stock is currently trading at new highs, supported by rising moving averages (20, 50, and 200 SMAs) and positive momentum indicators like a bullish MACD crossover. Investors should watch for potential near-term overbought conditions (RSI near 70), but the broader trend remains decidedly upward, with significant support layers formed during previous consolidations.
Included In Lists
Related Tickers of Interest
JPM Daily Chart
Sentiment
Short-term Sentiment (days to weeks): Bullish
The short-term trend is strongly bullish, with price printing higher highs and higher lows, currently trading at or near new highs and expanding the upper Bollinger Band. MACD is positive with the MACD line crossing above the signal line, and RSI is approaching overbought levels (near 70) but confirming upward momentum.
Long-term Sentiment (weeks to months): Bullish
The long-term trend is solidly bullish as price remains well above a rising 200-day SMA, and the 50-day SMA is also trending upwards. The overall market structure continues to demonstrate sustained upside momentum.
Report Metadata
- Timeframe: daily
- Generated at: 2026-07-24T21:03:36.398Z
- Model: gemini-3.1-pro-preview
Support Price Levels
| Level | Range | Strength | Notes |
|---|---|---|---|
| $339.50 | $338.00 - $341.00 | Strong | Recent consolidation area and swing low prior to the latest breakout. Coincides near the 20-day SMA. |
| $324.00 | $322.00 - $326.00 | Strong | Previous major swing high that now acts as support, aligning near the rising 50-day SMA. |
| $300.00 | $295.00 - $305.00 | Weak | Deeper structural support level from previous extended consolidation. |
Resistance Price Levels
| Level | Range | Strength | Notes |
|---|---|---|---|
| $357.50 | $355.00 - $360.00 | Weak | Immediate psychological resistance levels above the current all-time/recent high, as price is currently in price discovery mode. |
Potential Chart Patterns in Formation
| Strength | Pattern | Signal | Target | Details |
|---|---|---|---|---|
| Strong | Ascending Channel / Uptrend | Bullish | N/A | Price is consistently making higher highs and higher lows, supported by rising moving averages. |
| Strong | Bull Flag Breakout | Bullish | $365.00 | Recent price action shows a breakout from a short consolidation period (flag), continuing the previous upward thrust. |
Frequently Asked Questions about JPM
What is the current sentiment for JPM?
The short-term sentiment for JPM is currently Bullish because The short-term trend is strongly bullish, with price printing higher highs and higher lows, currently trading at or near new highs and expanding the upper Bollinger Band. MACD is positive with the MACD line crossing above the signal line, and RSI is approaching overbought levels (near 70) but confirming upward momentum.. The long-term trend is classified as Bullish.
What are the key support levels for JPM?
StockDips.AI has identified key support levels for JPM at $339.50 and $324.00. These levels may represent potential accumulation zones where buying interest could emerge.
Is JPM in a significant dip or a Value Dip right now?
JPM has a Value Score of 24/100. It is not currently flagged as a significant dip in the Top Dips list. It is not listed as a Value Dip because the long-term sentiment or value-score threshold does not qualify.
View the full interactive analysis on StockDips.AI.