UBER Weekly Technical Analysis
Uber Technologies Inc
Platform for ride-hailing, food delivery via Uber Eats, and freight services.
UBER Technical Analysis Summary
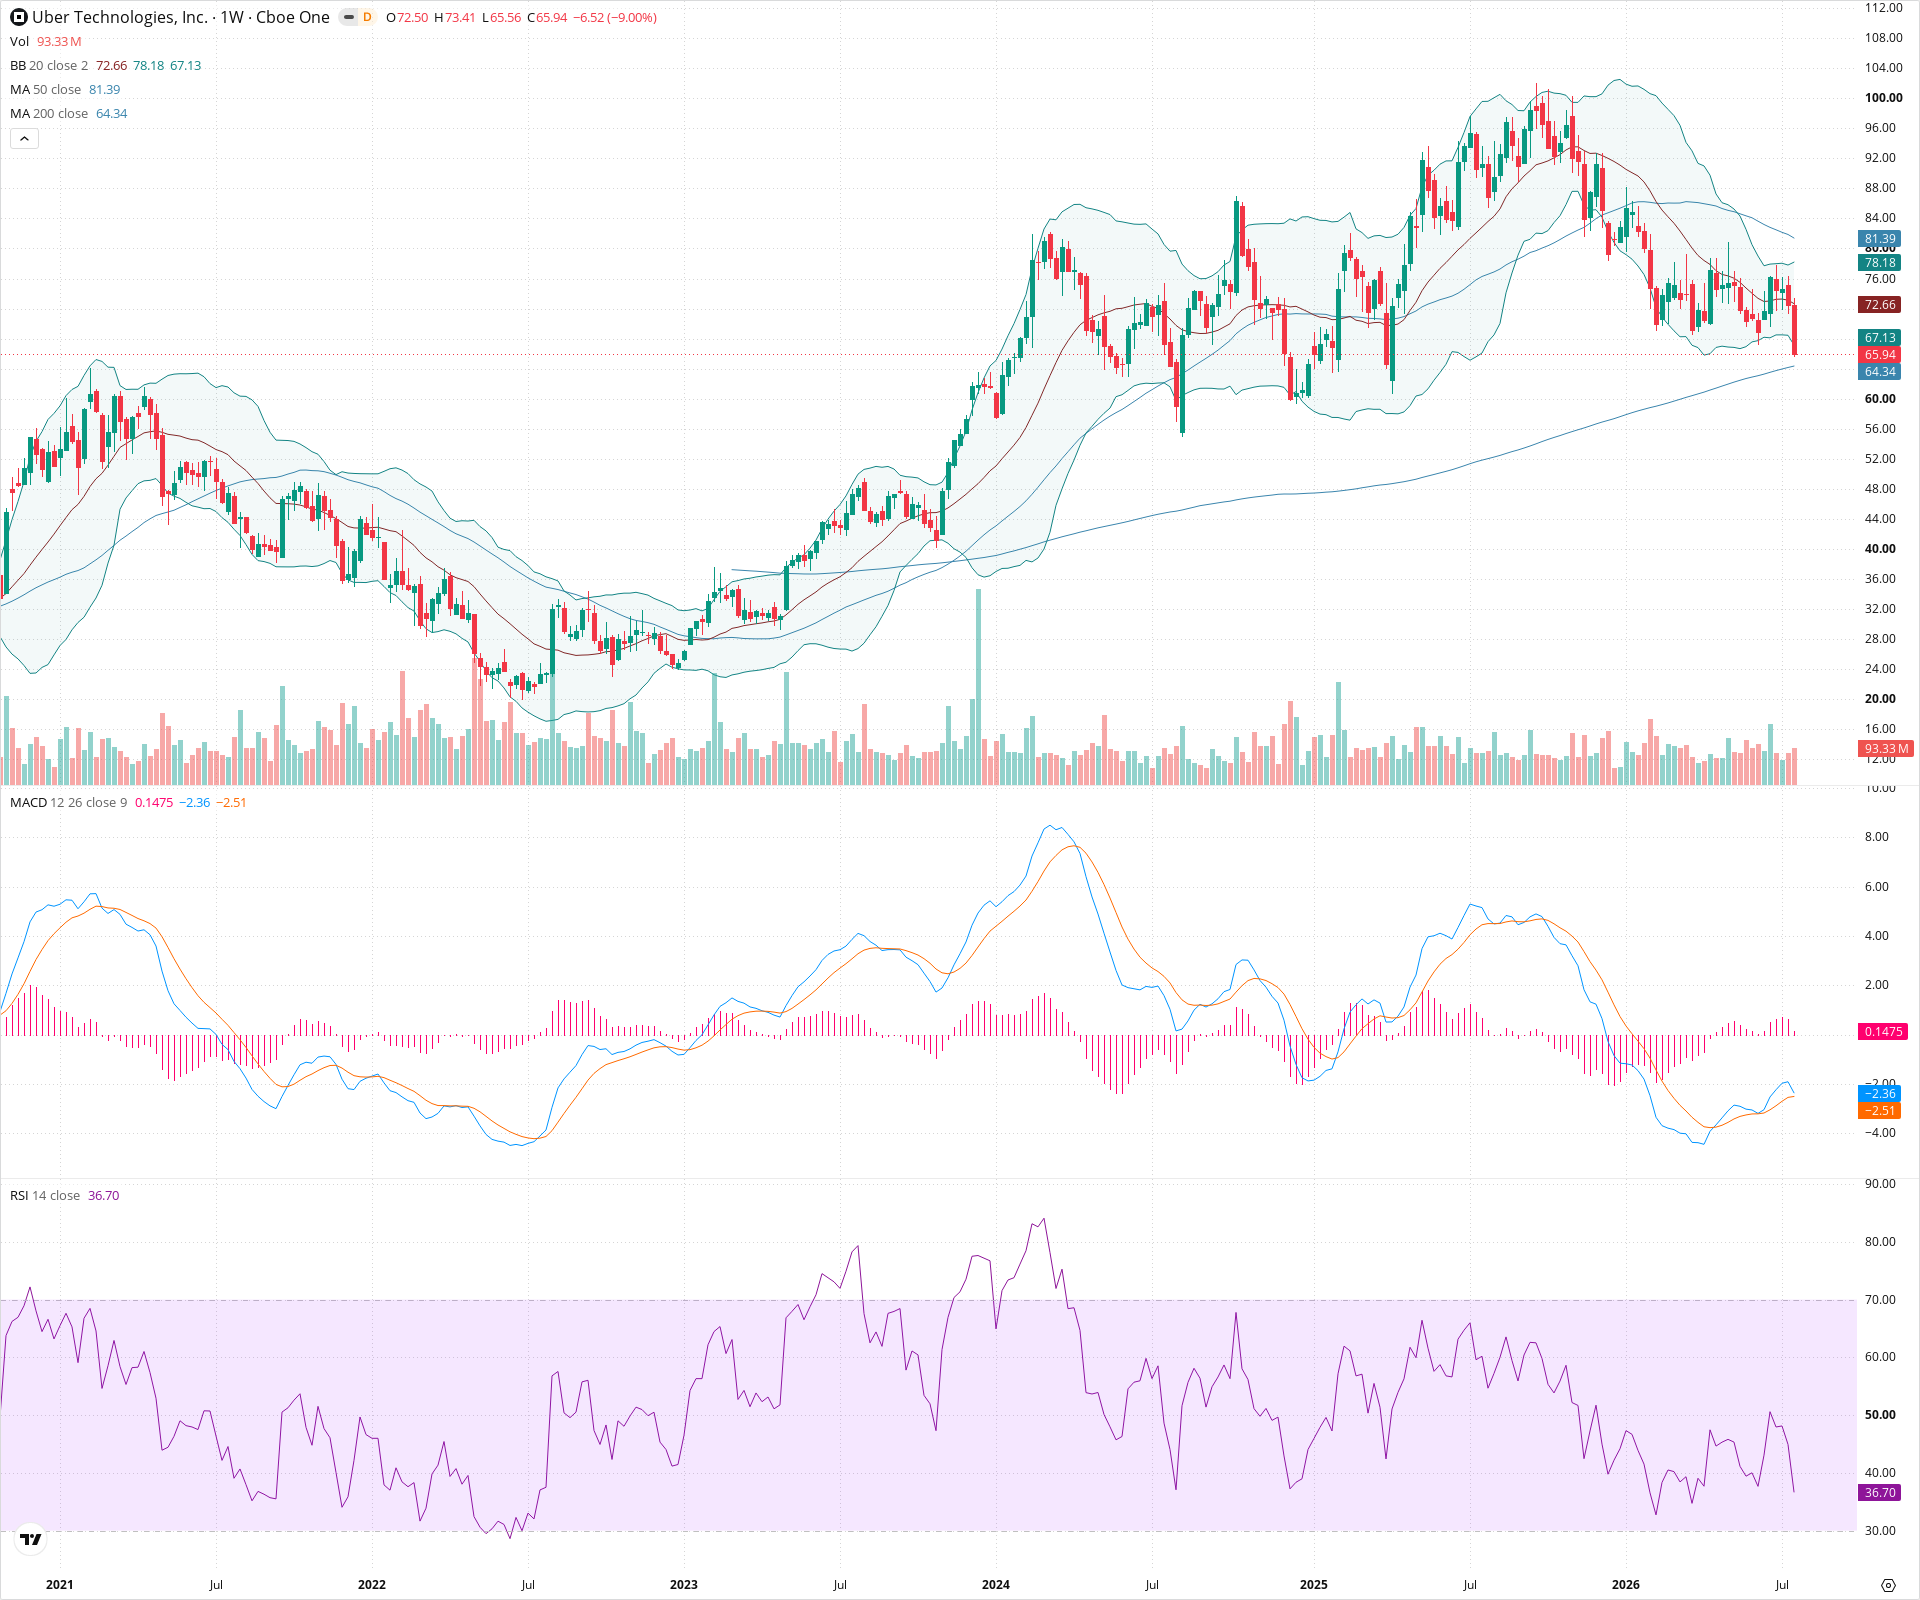
UBER is currently experiencing a significant correction following a prolonged uptrend, marked by a series of lower highs and a recent sharp breakdown below the 50-week SMA. The stock is now testing the crucial 200-week SMA, which will be a decisive battleground for long-term investors. A successful defense of this level could signal a stabilization phase, whereas a confirmed breakdown would indicate deeper structural weakness.
Included In Lists
Related Tickers of Interest
UBER Weekly Chart
Sentiment
Short-term Sentiment (days to weeks): Bearish
The price has suffered a sharp weekly decline, breaking below the 50-week SMA and the lower Bollinger Band. RSI is declining towards the oversold territory, and MACD remains in negative territory.
Long-term Sentiment (weeks to months): Neutral
The stock has given back a significant portion of its prior major uptrend but is currently testing the critical long-term support of the 200-week SMA. The long-term trend hangs in the balance depending on whether this moving average holds.
Report Metadata
- Timeframe: weekly
- Generated at: 2026-07-25T09:05:29.100Z
- Model: gemini-3.1-pro-preview
Support Price Levels
| Level | Range | Strength | Notes |
|---|---|---|---|
| $62.25 | $60.00 - $64.50 | Strong | Confluence of the rising 200-week SMA (64.34) and a prior consolidation zone from late 2023/early 2024. |
| $46.00 | $44.00 - $48.00 | Strong | Major breakout zone from mid-2023 that served as a launching pad for the run to all-time highs. |
Resistance Price Levels
| Level | Range | Strength | Notes |
|---|---|---|---|
| $80.00 | $78.00 - $82.00 | Strong | Recent breakdown level now acting as resistance, reinforced by the 20-week (78.18) and 50-week (81.39) SMAs. |
| $90.00 | $88.00 - $92.00 | Strong | Significant lower high established during the recent downtrend. |
| $102.00 | $100.00 - $104.00 | Strong | All-time high peak area. |
Potential Chart Patterns in Formation
| Strength | Pattern | Signal | Target | Details |
|---|---|---|---|---|
| Strong | Downtrend / Lower Highs | Bearish | N/A | Since peaking near 100, the stock has formed a series of lower highs and lower lows, indicating a structural shift from accumulation to distribution. |
Frequently Asked Questions about UBER
What is the current sentiment for UBER?
The short-term sentiment for UBER is currently Bearish because The price has suffered a sharp weekly decline, breaking below the 50-week SMA and the lower Bollinger Band. RSI is declining towards the oversold territory, and MACD remains in negative territory.. The long-term trend is classified as Neutral.
What are the key support levels for UBER?
StockDips.AI has identified key support levels for UBER at $62.25 and $46.00. These levels may represent potential accumulation zones where buying interest could emerge.
Is UBER in a significant dip or a Value Dip right now?
UBER has a Value Score of 88/100. It is currently flagged as a significant dip in the Top Dips list. It is not listed as a Value Dip because the long-term sentiment or value-score threshold does not qualify.
View the full interactive analysis on StockDips.AI.