RDDT Daily Technical Analysis
Reddit Inc
Social media platform organized by communities with strong retail investor influence.
RDDT Technical Analysis Summary
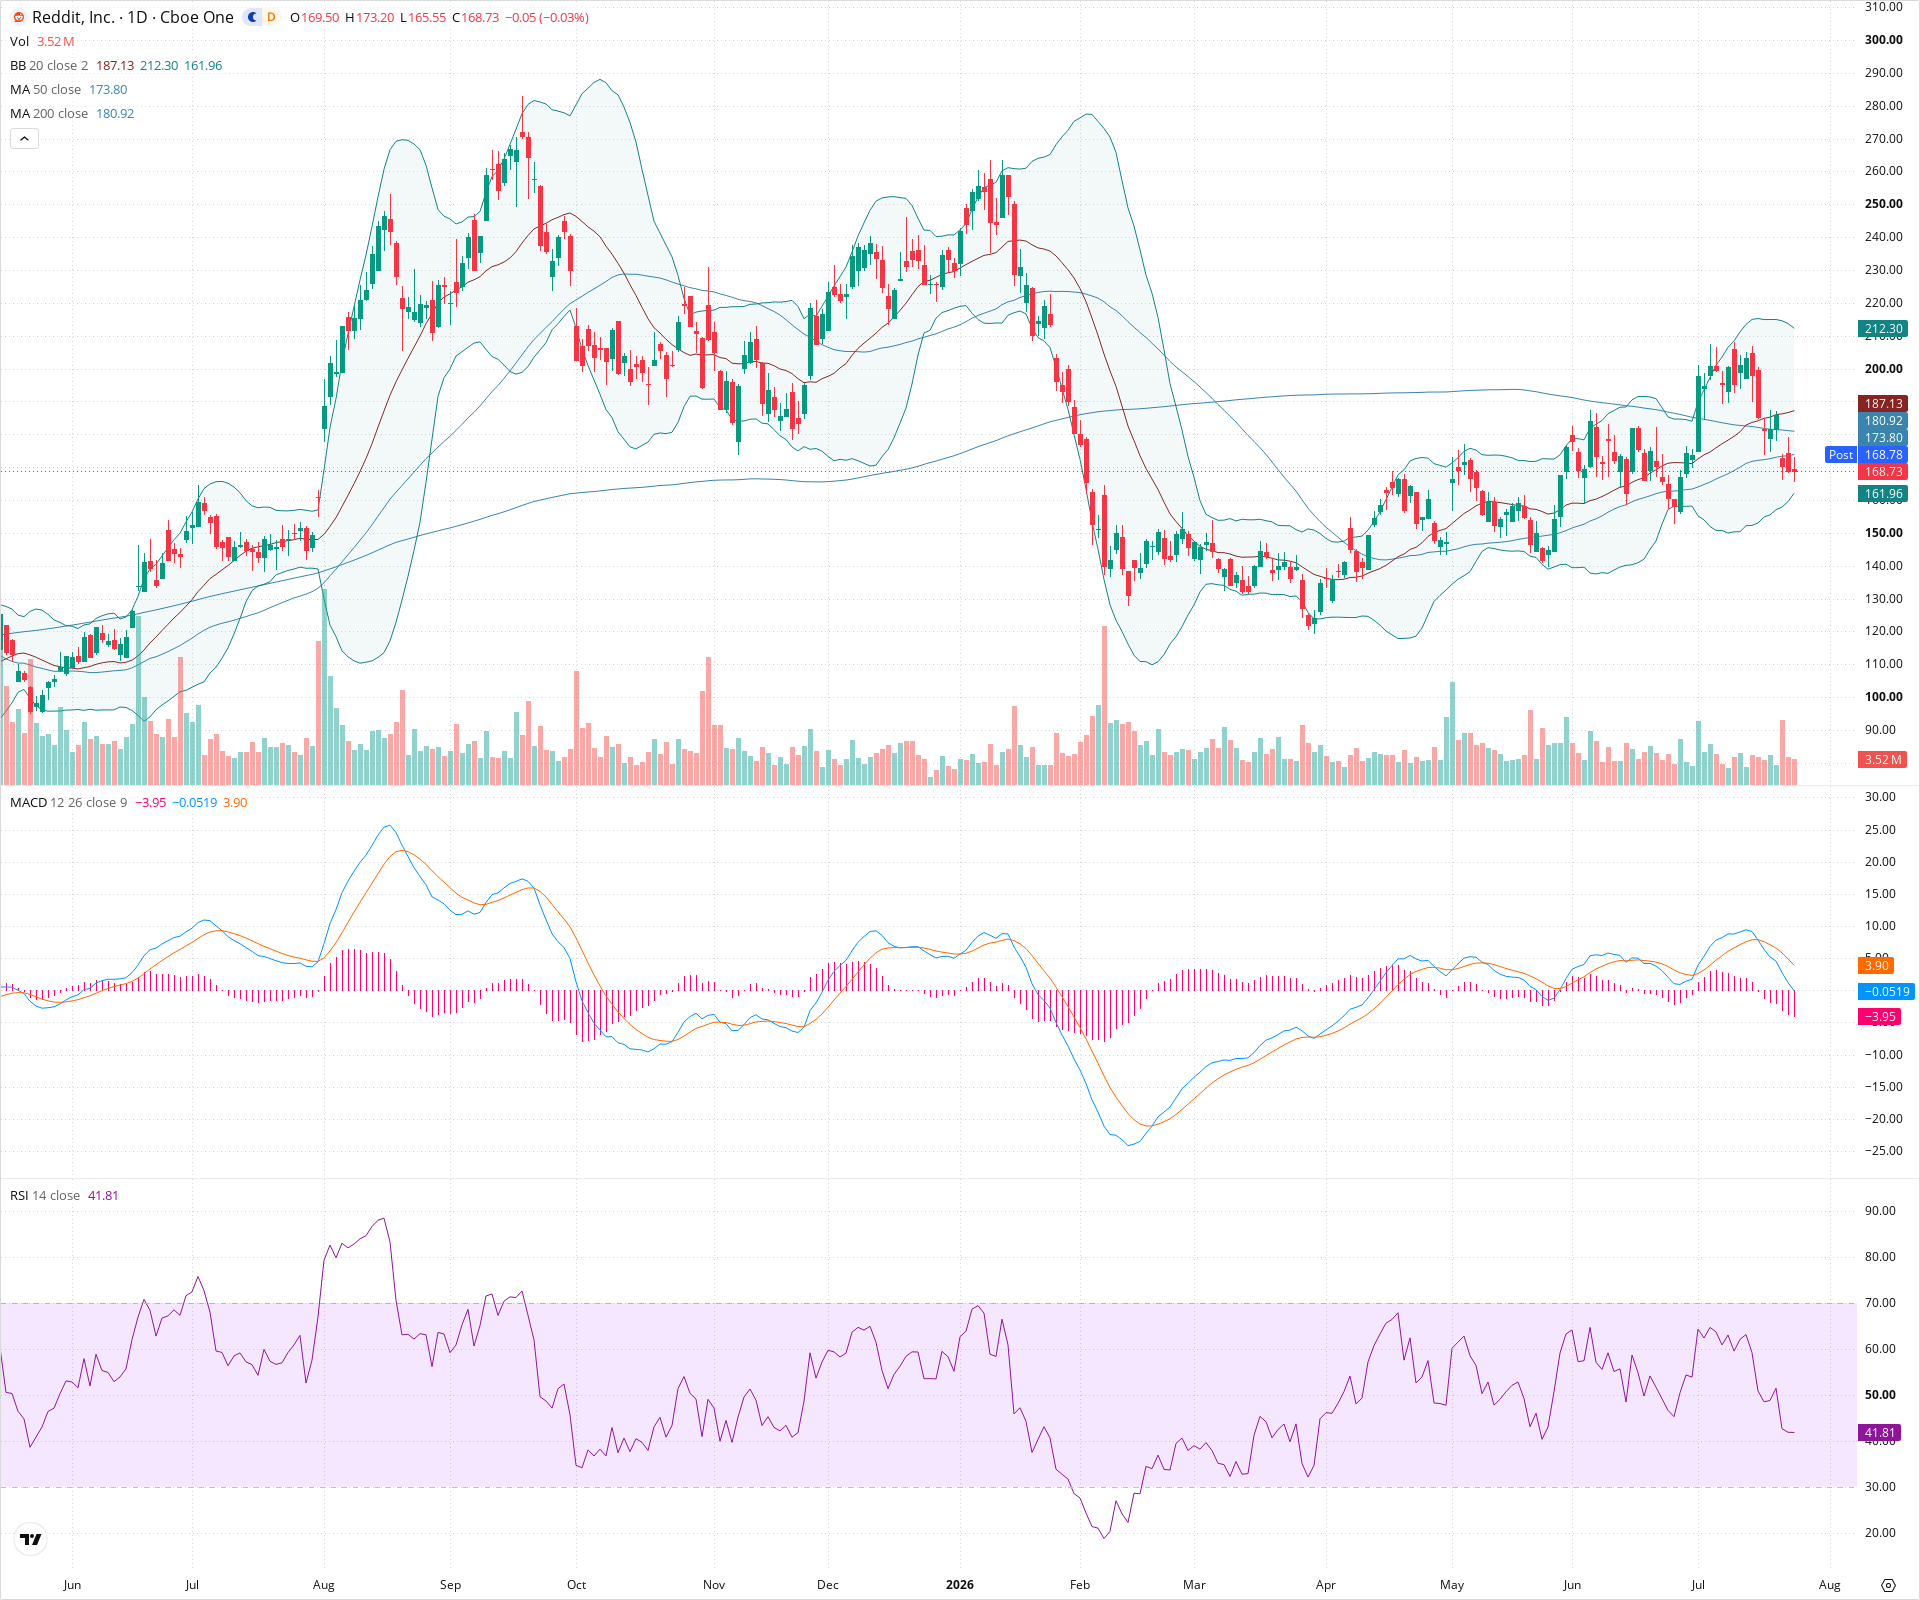
RDDT is exhibiting significant technical weakness across multiple timeframes. The stock has failed a recent recovery attempt, forming a lower high, and has subsequently broken back below critical long-term moving averages (50 and 200-day SMAs). With bearish momentum accelerating on the MACD and price nearing a test of immediate support around 160-165, the path of least resistance appears to be lower. Long-term investors should exercise caution until a durable base is formed and the 200-day moving average is reclaimed.
Included In Lists
Related Tickers of Interest
RDDT Daily Chart
Sentiment
Short-term Sentiment (days to weeks): Bearish
Price is breaking down below the 50-day SMA and moving towards the lower Bollinger Band. Momentum indicators confirm this weakness, with a bearish MACD crossover, expanding negative histogram, and RSI falling below 50.
Long-term Sentiment (weeks to months): Bearish
The stock is trading below both its 50-day and 200-day SMAs, and a 'death cross' (50 SMA below 200 SMA) is present, indicating a sustained long-term downtrend structure following a massive previous peak.
Report Metadata
- Timeframe: daily
- Generated at: 2026-07-24T21:16:33.598Z
- Model: gemini-3.1-pro-preview
Support Price Levels
| Level | Range | Strength | Notes |
|---|---|---|---|
| $162.50 | $160.00 - $165.00 | Moderate | Immediate support zone near the lower Bollinger Band (approx 161.96) and recent minor swing lows. |
| $130.00 | $125.00 - $135.00 | Strong | Major structural support zone established by the deep swing lows earlier in the chart's visible timeframe. |
Resistance Price Levels
| Level | Range | Strength | Notes |
|---|---|---|---|
| $177.00 | $173.00 - $181.00 | Strong | A cluster of dynamic resistance formed by the 50-day SMA (173.80) and the 200-day SMA (180.92). |
| $200.00 | $195.00 - $205.00 | Moderate | Recent consolidation area and lower high swing point before the current leg down. |
Potential Chart Patterns in Formation
| Strength | Pattern | Signal | Target | Details |
|---|---|---|---|---|
| Strong | Double Top (Recent) | Bearish | $115.00 | The recent price action on the right side of the chart shows two distinct peaks near the 215-220 level, failing to make new highs. The price is currently breaking down towards the 'neckline' support area. |
Frequently Asked Questions about RDDT
What is the current sentiment for RDDT?
The short-term sentiment for RDDT is currently Bearish because Price is breaking down below the 50-day SMA and moving towards the lower Bollinger Band. Momentum indicators confirm this weakness, with a bearish MACD crossover, expanding negative histogram, and RSI falling below 50.. The long-term trend is classified as Bearish.
What are the key support levels for RDDT?
StockDips.AI has identified key support levels for RDDT at $162.50 and $130.00. These levels may represent potential accumulation zones where buying interest could emerge.
Is RDDT in a significant dip or a Value Dip right now?
RDDT has a Value Score of 57/100. It is not currently flagged as a significant dip in the Top Dips list. It is not listed as a Value Dip because the long-term sentiment or value-score threshold does not qualify.
View the full interactive analysis on StockDips.AI.