UBER Monthly Technical Analysis
Uber Technologies Inc
Platform for ride-hailing, food delivery via Uber Eats, and freight services.
UBER Technical Analysis Summary
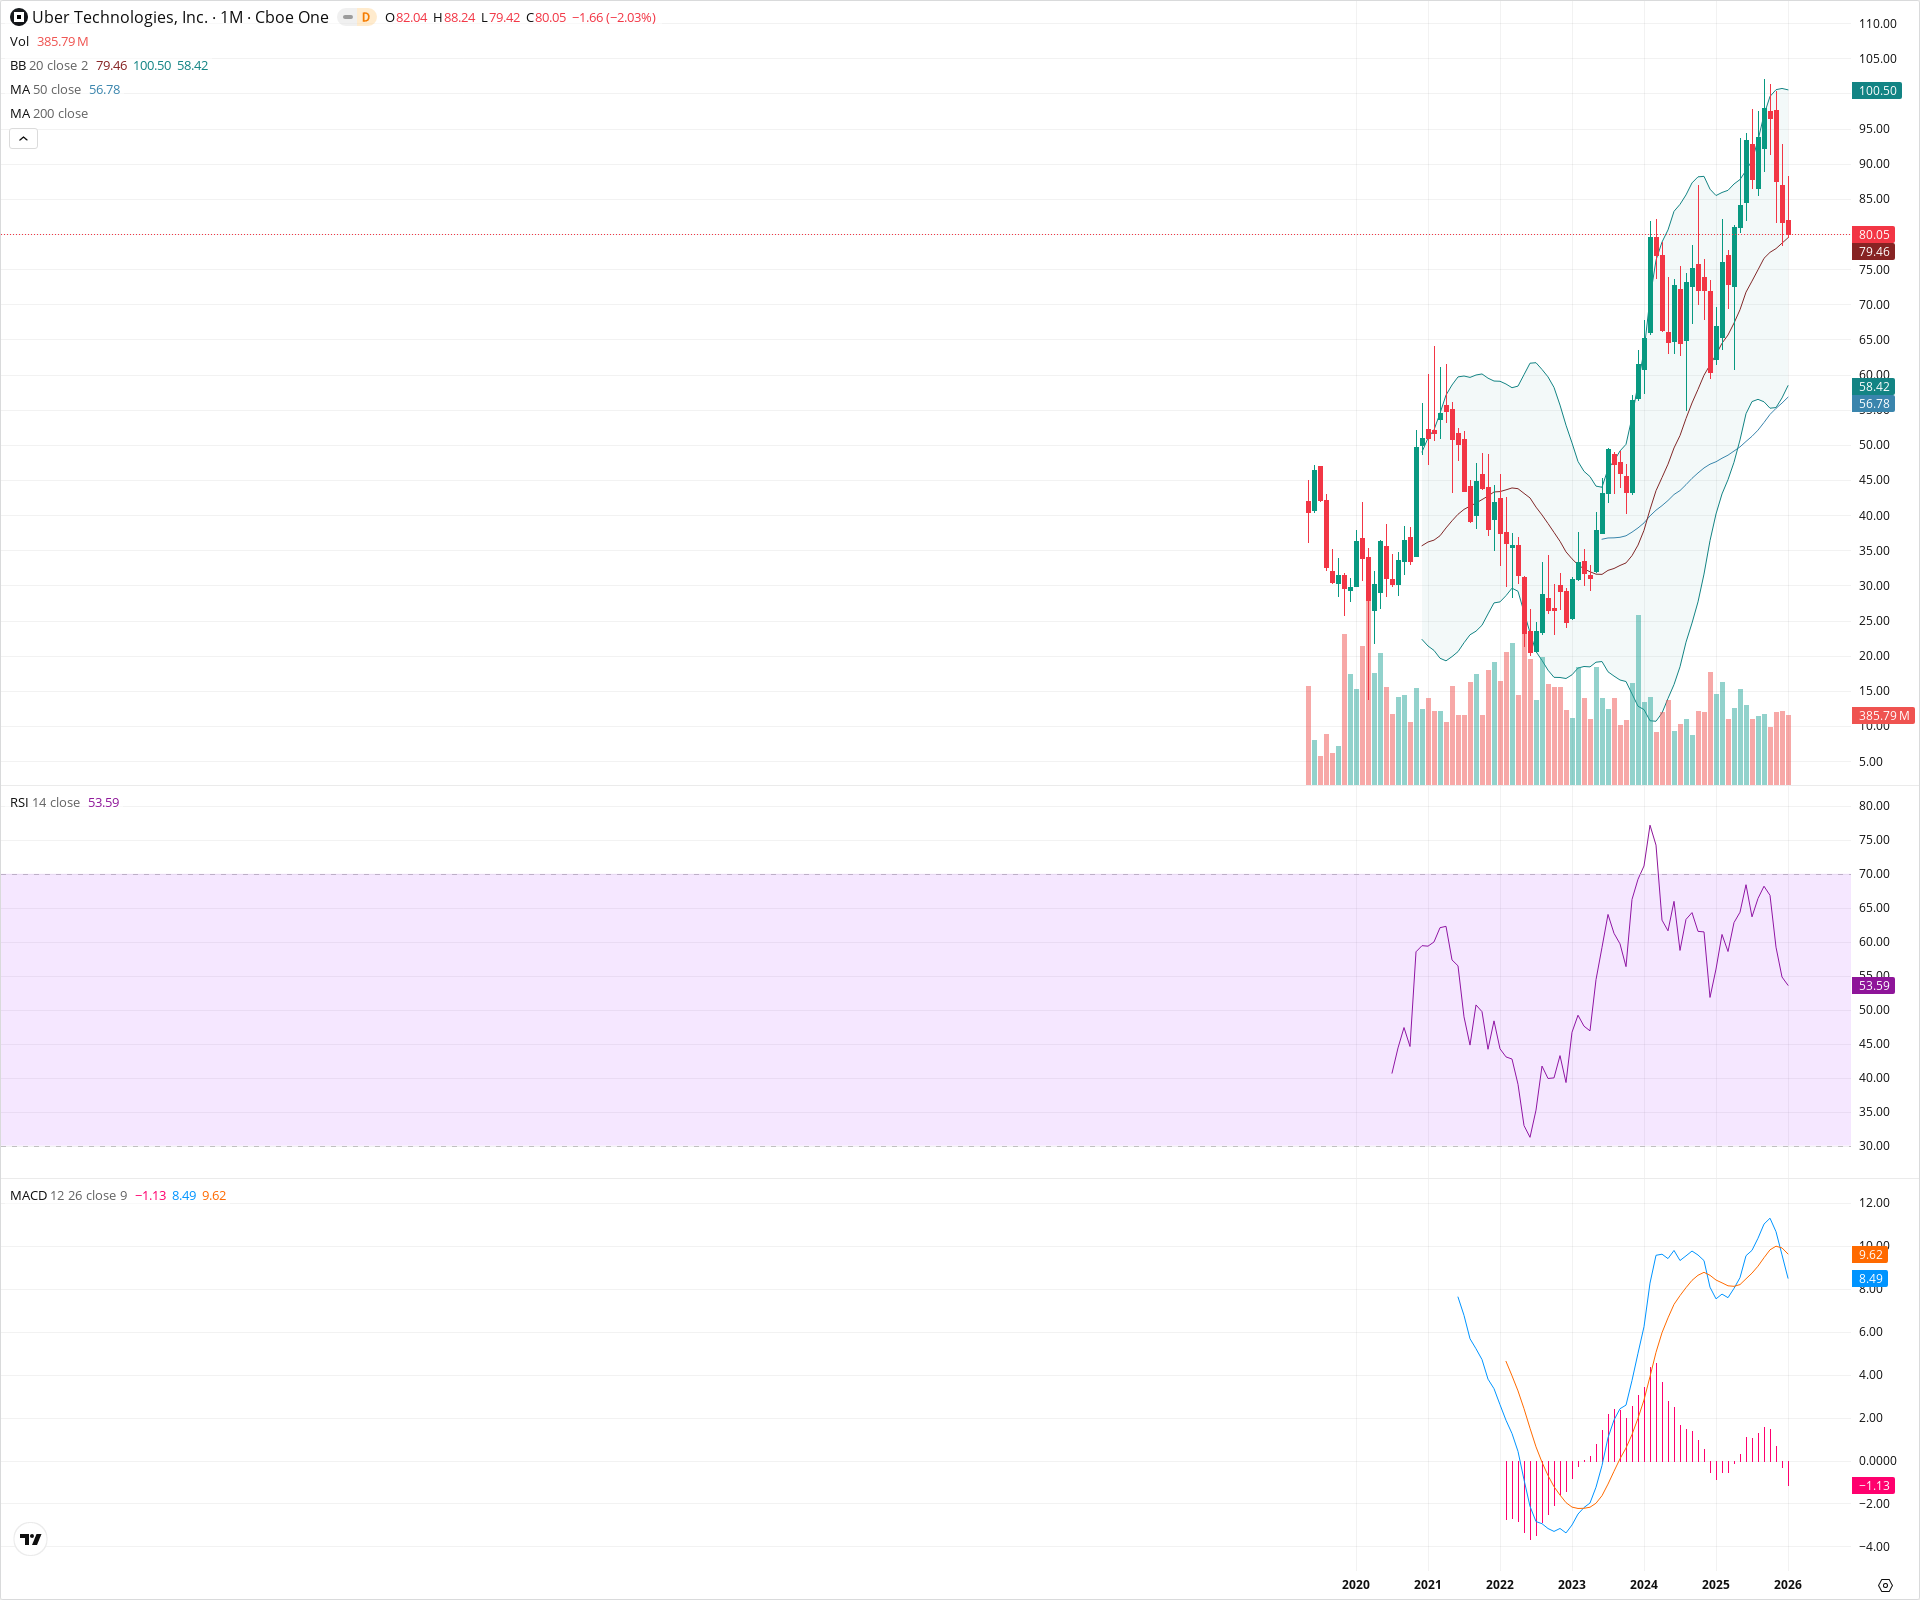
Uber Technologies is exhibiting a classic long-term uptrend, having broken out of a multi-year base to reach new all-time highs. While the secular trend remains robust with price well above the 50-month SMA, short-term indicators like the MACD bearish crossover suggest a period of consolidation or momentum cooling is underway. The stock is currently testing critical dynamic support at the 20-month SMA; holding this level is key for immediate trend continuation.
Included In Lists
Related Tickers of Interest
UBER Monthly Chart
Sentiment
Short-term Sentiment (days to weeks): Neutral
Price is consolidating after a strong run, currently testing the 20-month SMA support at roughly $79.50. A bearish crossover on the MACD and a negative histogram suggest momentum is cooling in the near term.
Long-term Sentiment (weeks to months): Bullish
The stock is in a confirmed secular uptrend, trading well above the rising 50-month SMA. The price structure shows clear higher highs and higher lows emerging from the 2022 bottom.
Report Metadata
- Timeframe: monthly
- Generated at: 2026-02-02T06:59:21.211Z
- Model: gemini-3-pro-preview
Support Price Levels
| Level | Range | Strength | Notes |
|---|---|---|---|
| $79.50 | $79.00 - $80.00 | Strong | Confluence of current price action and the 20-month SMA (Bollinger Band midline). |
| $64.00 | $63.00 - $65.00 | Strong | Former multi-year resistance (2021 highs) that now acts as major structural support after the breakout. |
| $57.00 | $56.00 - $58.00 | Weak | Location of the rising 50-month SMA and lower Bollinger Band area. |
Resistance Price Levels
| Level | Range | Strength | Notes |
|---|---|---|---|
| $87.62 | $87.00 - $88.24 | Strong | Recent all-time high area acting as the immediate ceiling. |
| $100.25 | $100.00 - $100.50 | Weak | Psychological level and current position of the upper Bollinger Band. |
Potential Chart Patterns in Formation
| Strength | Pattern | Signal | Target | Details |
|---|---|---|---|---|
| Strong | Secular Base Breakout | Bullish | N/A | Price formed a massive base from 2021 to 2023, successfully breaking out above the ~$64 level in early 2024 to enter a new discovery phase. |
Frequently Asked Questions about UBER
What is the current sentiment for UBER?
The short-term sentiment for UBER is currently Neutral because Price is consolidating after a strong run, currently testing the 20-month SMA support at roughly $79.50. A bearish crossover on the MACD and a negative histogram suggest momentum is cooling in the near term.. The long-term trend is classified as Bullish.
What are the key support levels for UBER?
StockDips.AI has identified key support levels for UBER at $79.50 and $64.00. These levels may represent potential accumulation zones where buying interest could emerge.
Is UBER in a significant dip or a Value Dip right now?
UBER has a Value Score of 88/100. It is currently flagged as a significant dip in the Top Dips list. It is also listed as a Value Dip because long-term sentiment is bullish.
View the full interactive analysis on StockDips.AI.