UNH Monthly Technical Analysis
UnitedHealth Group Inc
Health insurance and services company operating UnitedHealthcare and Optum divisions.
UNH Technical Analysis Summary
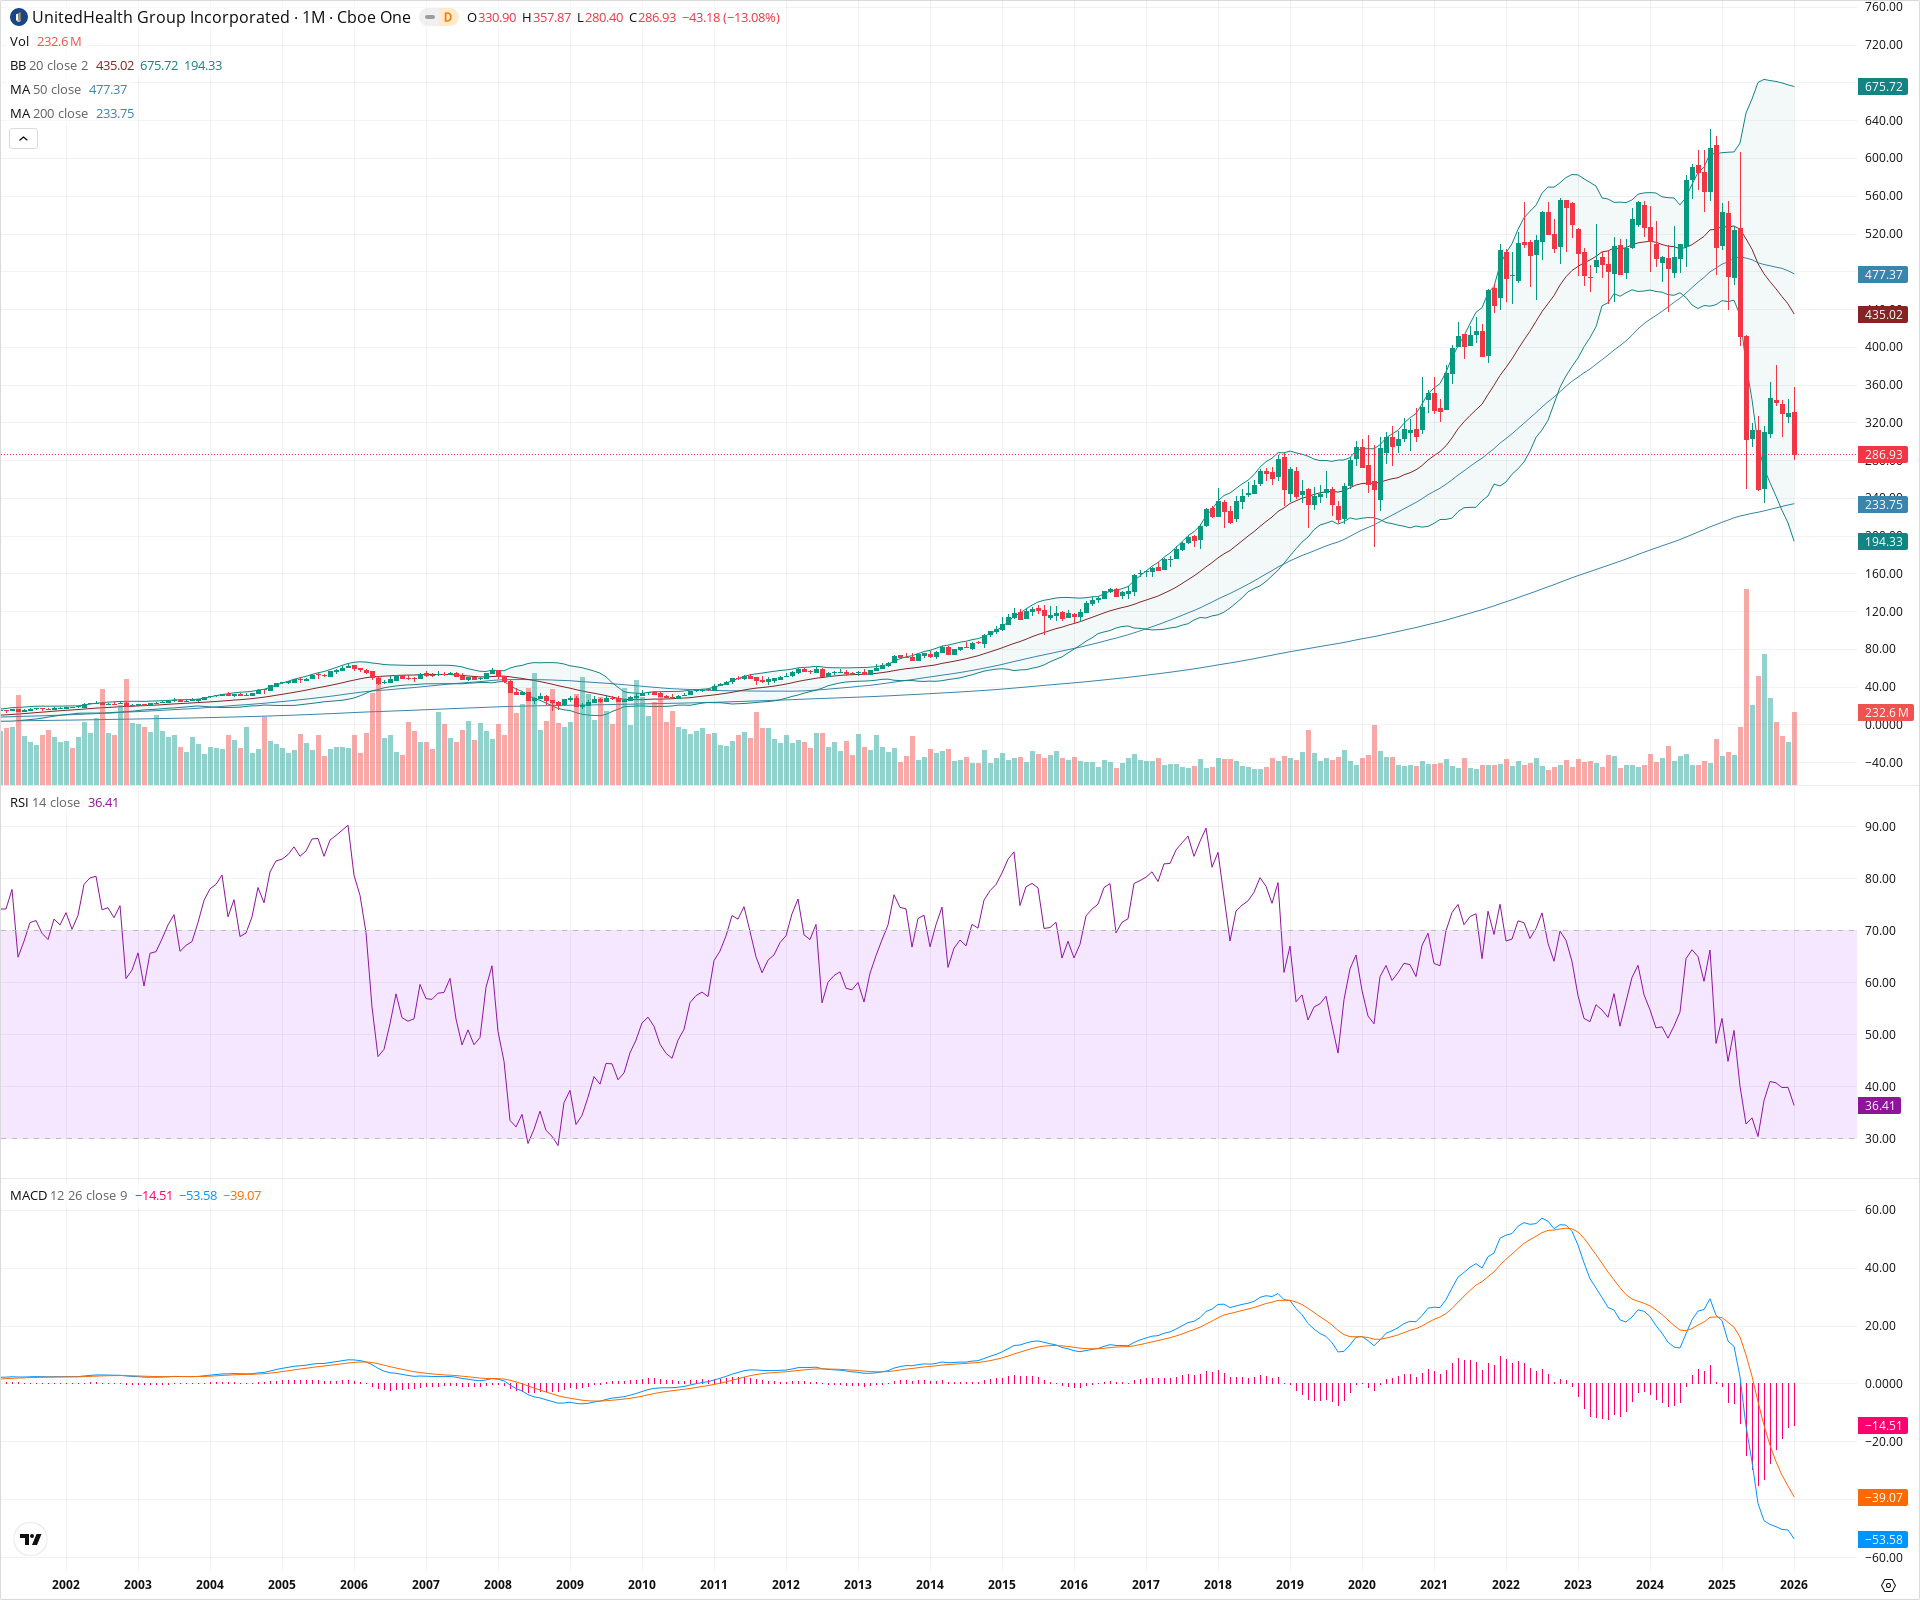
UnitedHealth Group has entered a severe correction phase, breaking key medium-term structures including the 50-month SMA. The appearance of a large bearish candle on high volume, accompanied by a MACD plunge below zero, signals a decided regime change from the multi-year uptrend. While immediate support exists around the $280–$300 area, the technical damage suggests a potential test of the 200-month SMA near $233.
Included In Lists
Related Tickers of Interest
UNH Monthly Chart
Sentiment
Short-term Sentiment (days to weeks): Bearish
The current monthly candle is massive and red, showing a decline of over 13% with a significant spike in selling volume. The RSI has dropped sharply to 36, indicating strong downward momentum without yet reaching oversold extremes.
Long-term Sentiment (weeks to months): Bearish
The price has decisively broken below the 50-period SMA and the 'basis' (20 SMA) of the Bollinger Bands. The MACD has crossed significantly below the zero line, confirming a major shift from a secular bull regime to a bearish or corrective phase.
Report Metadata
- Timeframe: monthly
- Generated at: 2026-02-02T06:59:30.610Z
- Model: gemini-3-pro-preview
Support Price Levels
| Level | Range | Strength | Notes |
|---|---|---|---|
| $290.00 | $280.00 - $300.00 | Weak | Immediate support zone aligning with current month lows and the breakout levels from the 2019-2020 period. |
| $234.00 | $233.00 - $235.00 | Strong | Convergence with the 200-month SMA, representing the primary long-term secular trendline. |
| $197.00 | $194.00 - $200.00 | Strong | Coincides with the Lower Bollinger Band and major structural resistance-turned-support from 2018. |
Resistance Price Levels
| Level | Range | Strength | Notes |
|---|---|---|---|
| $345.00 | $330.00 - $360.00 | Weak | Immediate overhead supply from the current candle's open and recent breakdown area. |
| $442.50 | $435.00 - $450.00 | Strong | Major structural resistance formed by the 20-month SMA and the neckline of the recent top formation. |
| $478.50 | $477.00 - $480.00 | Strong | The 50-month SMA, which previously acted as dynamic support, now serves as significant resistance. |
Potential Chart Patterns in Formation
| Strength | Pattern | Signal | Target | Details |
|---|---|---|---|---|
| Strong | Complex Top / Distribution | Bearish | $233.00 | A multi-year topping structure between 450 and 550 roughly from 2022 to 2024, followed by a violent breakdown. |
Frequently Asked Questions about UNH
What is the current sentiment for UNH?
The short-term sentiment for UNH is currently Bearish because The current monthly candle is massive and red, showing a decline of over 13% with a significant spike in selling volume. The RSI has dropped sharply to 36, indicating strong downward momentum without yet reaching oversold extremes.. The long-term trend is classified as Bearish.
What are the key support levels for UNH?
StockDips.AI has identified key support levels for UNH at $290.00 and $234.00. These levels may represent potential accumulation zones where buying interest could emerge.
Is UNH in a significant dip or a Value Dip right now?
UNH has a Value Score of 57/100. It is not currently flagged as a significant dip in the Top Dips list. It is not listed as a Value Dip because the long-term sentiment or value-score threshold does not qualify.
View the full interactive analysis on StockDips.AI.