XYZ Monthly Technical Analysis
Block, Inc
Block operates an ecosystem of financial products and services: Square, Cash App, Afterpay
XYZ Technical Analysis Summary
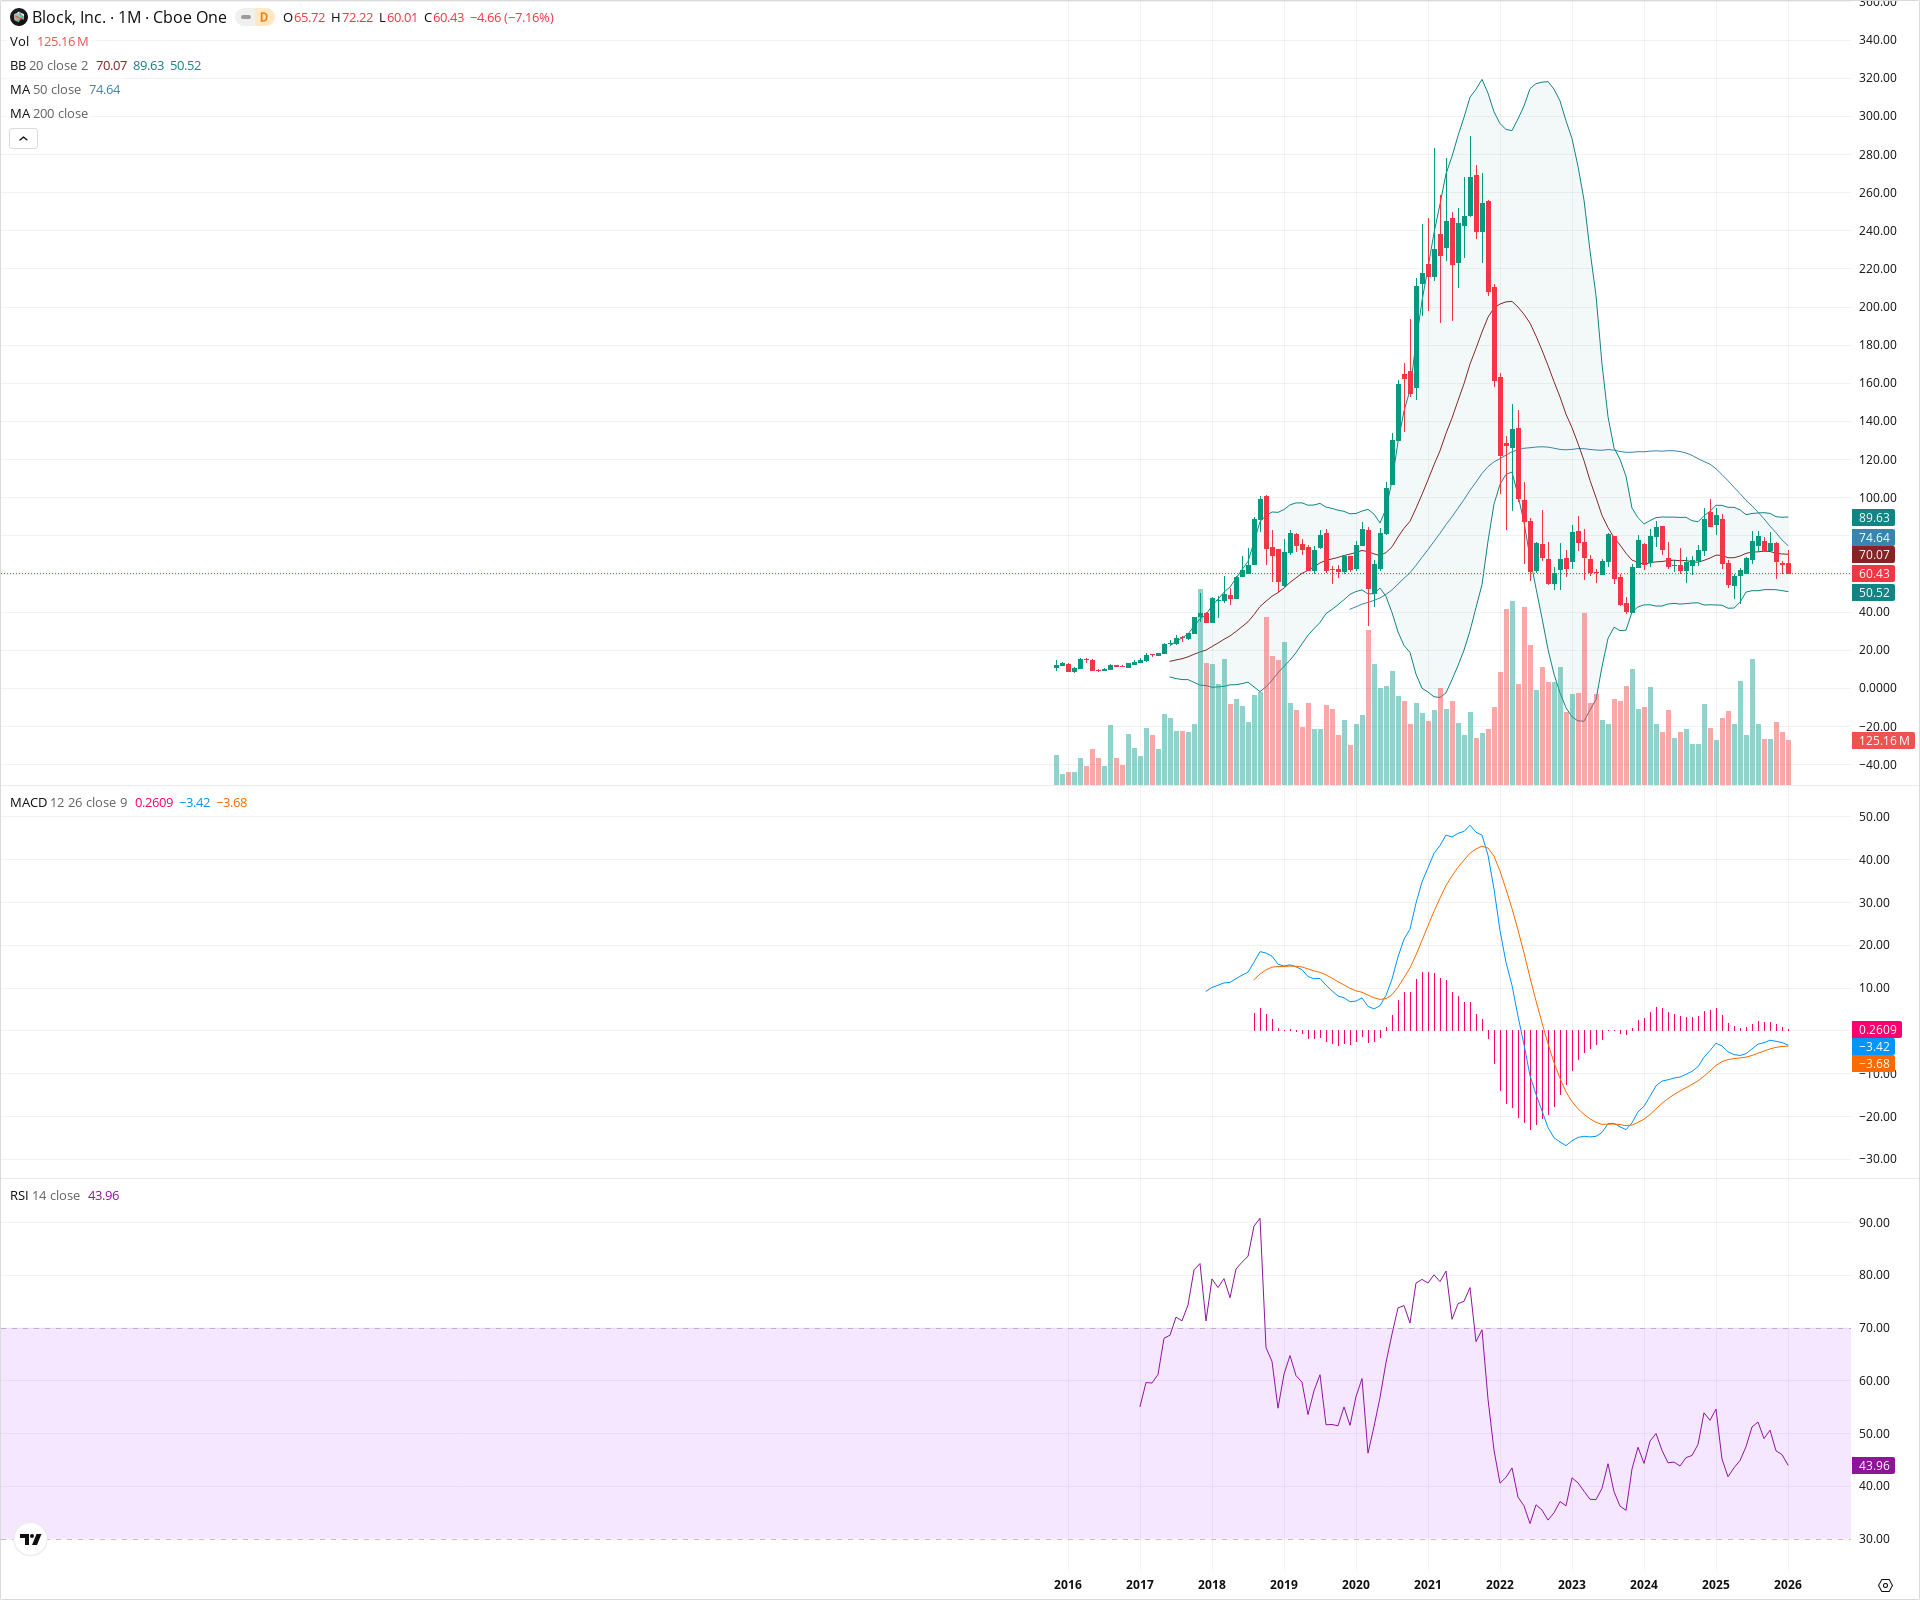
Block, Inc. remains trapped in a multi-year consolidation structure, trading sideways between long-term support at ~$40 and resistance near ~$90. The technical posture is currently leaning bearish in the short term as price trades below key moving averages (20 and 50 SMAs) and heads toward the lower half of the range. A decisive breakout above $90 or breakdown below $40 is required to define the next secular trend.
Included In Lists
Related Tickers of Interest
XYZ Monthly Chart
Sentiment
Short-term Sentiment (days to weeks): Bearish
Price is trading below the 20-month and 50-month SMAs and was recently rejected from the top of the consolidation range. The current monthly candle is red, pushing towards lower support levels.
Long-term Sentiment (weeks to months): Neutral
The stock has been in a prolonged consolidation phase (secular base building) between roughly $40 and $90 since mid-2022, following a major downtrend. Moving averages are flattening, indicating a lack of long-term trend direction.
Report Metadata
- Timeframe: monthly
- Generated at: 2026-02-02T07:00:33.210Z
- Model: gemini-3-pro-preview
Support Price Levels
| Level | Range | Strength | Notes |
|---|---|---|---|
| $51.00 | $50.00 - $52.00 | Weak | Coincides with the Lower Bollinger Band (50.52). |
| $40.50 | $39.00 - $42.00 | Strong | Major secular lows established in 2022 and 2023; bottom of the long-term consolidation box. |
Resistance Price Levels
| Level | Range | Strength | Notes |
|---|---|---|---|
| $72.50 | $70.00 - $75.00 | Moderate | Cluster of moving averages: 20-month SMA (~70.07) and 50-month SMA (~74.64). |
| $88.50 | $87.00 - $90.00 | Strong | Upper Bollinger Band (~89.63) and recent swing highs rejected multiple times. |
Potential Chart Patterns in Formation
| Strength | Pattern | Signal | Target | Details |
|---|---|---|---|---|
| Strong | Secular Consolidation Rectangle | Neutral | N/A | Price has been oscillating in a defined horizontal channel between ~$40 support and ~$90 resistance for over two years. |
Frequently Asked Questions about XYZ
What is the current sentiment for XYZ?
The short-term sentiment for XYZ is currently Bearish because Price is trading below the 20-month and 50-month SMAs and was recently rejected from the top of the consolidation range. The current monthly candle is red, pushing towards lower support levels.. The long-term trend is classified as Neutral.
What are the key support levels for XYZ?
StockDips.AI has identified key support levels for XYZ at $51.00 and $40.50. These levels may represent potential accumulation zones where buying interest could emerge.
Is XYZ in a significant dip or a Value Dip right now?
XYZ has a Value Score of 26/100. It is not currently flagged as a significant dip in the Top Dips list. It is not listed as a Value Dip because the long-term sentiment or value-score threshold does not qualify.
View the full interactive analysis on StockDips.AI.