ABBV Weekly Technical Analysis
AbbVie Inc.
Biopharmaceutical company focused on immunology, oncology, aesthetics, and neuroscience; best known for Humira and newer drugs like Skyrizi and Rinvoq.
ABBV Technical Analysis Summary
ABBV is exhibiting a powerful, long-term bullish trend on the weekly timeframe. The stock recently resolved a multi-year consolidation phase with a strong upward breakout, supported by accelerating MACD momentum and a healthy RSI. While the aggressive vertical move along the upper Bollinger Band suggests a potential for near-term consolidation or minor pullback, the overarching technical structure strongly favors continued upside over the long term, with solid support established near previous breakout levels.
Included In Lists
Related Tickers of Interest
ABBV Weekly Chart
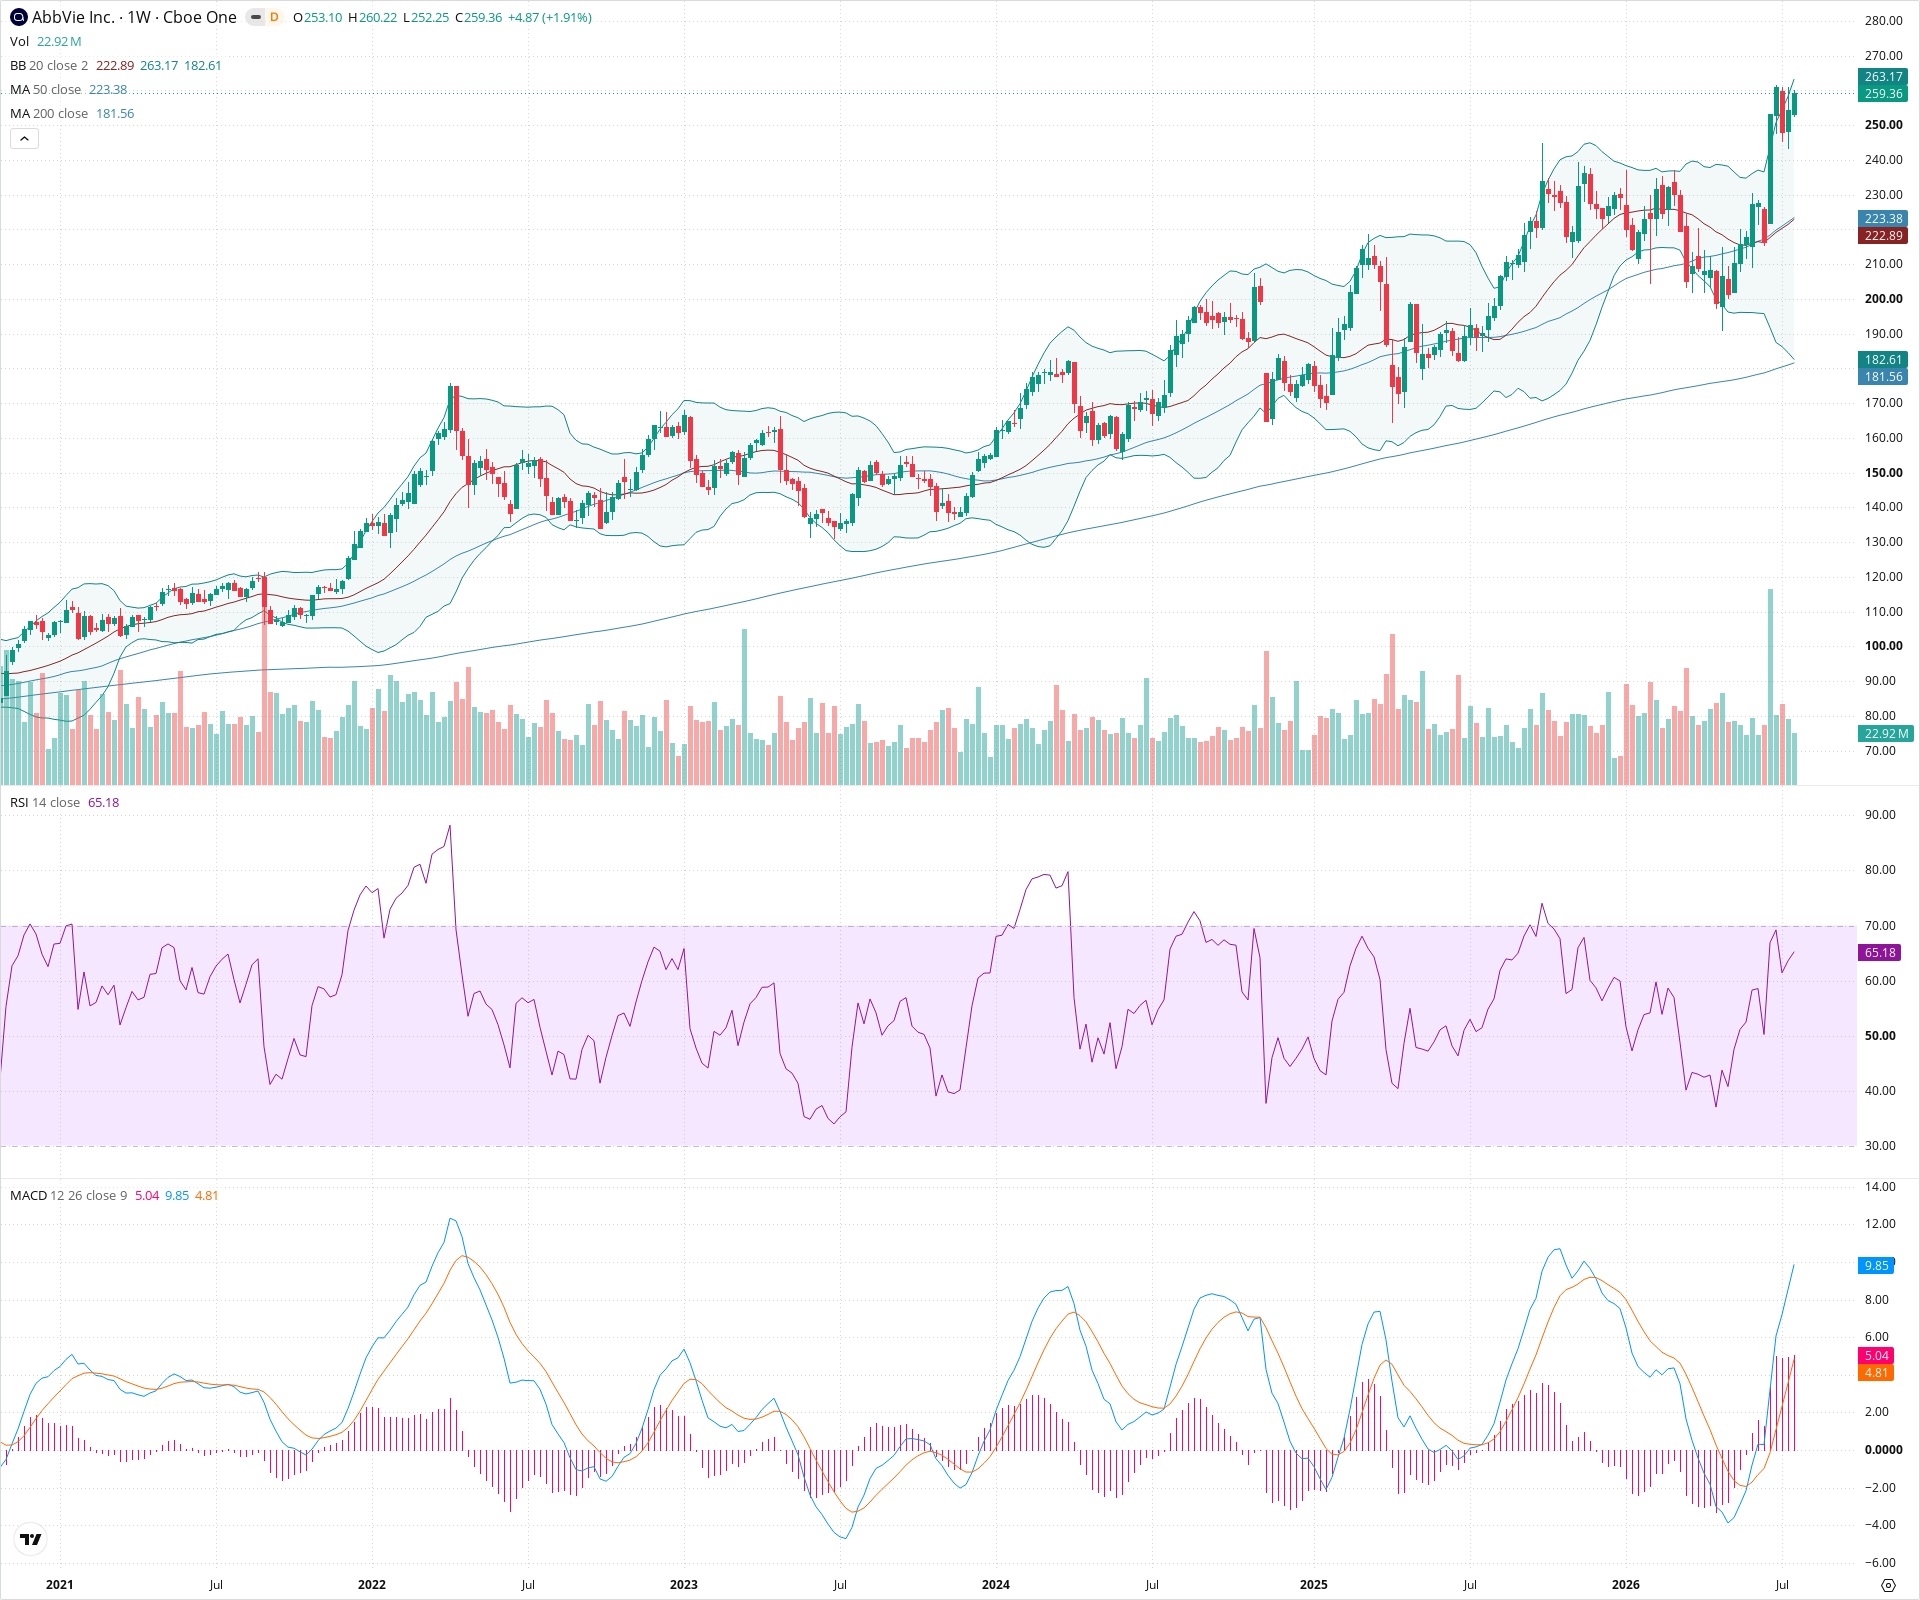
Sentiment
Short-term Sentiment (days to weeks): Bullish
Price is aggressively moving higher, printing consecutive bullish weekly candles and riding the upper Bollinger Band. MACD line has crossed above the signal line and is accelerating, confirming strong near-term upward momentum.
Long-term Sentiment (weeks to months): Bullish
The chart displays a clear, multi-year secular uptrend characterized by higher highs and higher lows. The price is well above the rising 50-week and 200-week SMAs, indicating sustained long-term buying pressure.
Report Metadata
- Timeframe: weekly
- Generated at: 2026-07-25T09:03:56.298Z
- Model: gemini-3.1-pro-preview
Support Price Levels
| Level | Range | Strength | Notes |
|---|---|---|---|
| $225.00 | $220.00 - $230.00 | Strong | Major prior resistance zone turned support, roughly coinciding with the current level of the rising 50-week SMA (223.38). |
| $185.00 | $180.00 - $190.00 | Strong | Significant multi-year structural support zone derived from multiple major swing lows and currently aligning near the 200-week SMA (181.56). |
Resistance Price Levels
| Level | Range | Strength | Notes |
|---|---|---|---|
| $270.00 | $265.00 - $275.00 | Weak | Price is currently at all-time highs on this chart; immediate resistance is estimated based on psychological round numbers and the trajectory of the upper Bollinger Band. |
Potential Chart Patterns in Formation
| Strength | Pattern | Signal | Target | Details |
|---|---|---|---|---|
| Strong | Multi-year Consolidation Breakout | Bullish | N/A | Price recently broke out above a massive, multi-year consolidation range (roughly 180-230) that persisted from 2022 through late 2023. The breakout is characterized by strong vertical momentum. |
Frequently Asked Questions about ABBV
What is the current sentiment for ABBV?
The short-term sentiment for ABBV is currently Bullish because Price is aggressively moving higher, printing consecutive bullish weekly candles and riding the upper Bollinger Band. MACD line has crossed above the signal line and is accelerating, confirming strong near-term upward momentum.. The long-term trend is classified as Bullish.
What are the key support levels for ABBV?
StockDips.AI has identified key support levels for ABBV at $225.00 and $185.00. These levels may represent potential accumulation zones where buying interest could emerge.
Is ABBV in a significant dip or a Value Dip right now?
ABBV has a Value Score of 35/100. It is not currently flagged as a significant dip in the Top Dips list. It is not listed as a Value Dip because the long-term sentiment or value-score threshold does not qualify.
View the full interactive analysis on StockDips.AI.