ABBV Monthly Technical Analysis
AbbVie Inc.
Biopharmaceutical company focused on immunology, oncology, aesthetics, and neuroscience; best known for Humira and newer drugs like Skyrizi and Rinvoq.
ABBV Technical Analysis Summary
ABBV is in a robust long-term uptrend, having recently broken out of a multi-year base to achieve new all-time highs. The momentum is strongly supported by rising moving averages and a bullish MACD configuration, suggesting the current pullback is a pause within a larger structural advance.
Included In Lists
Related Tickers of Interest
ABBV Monthly Chart
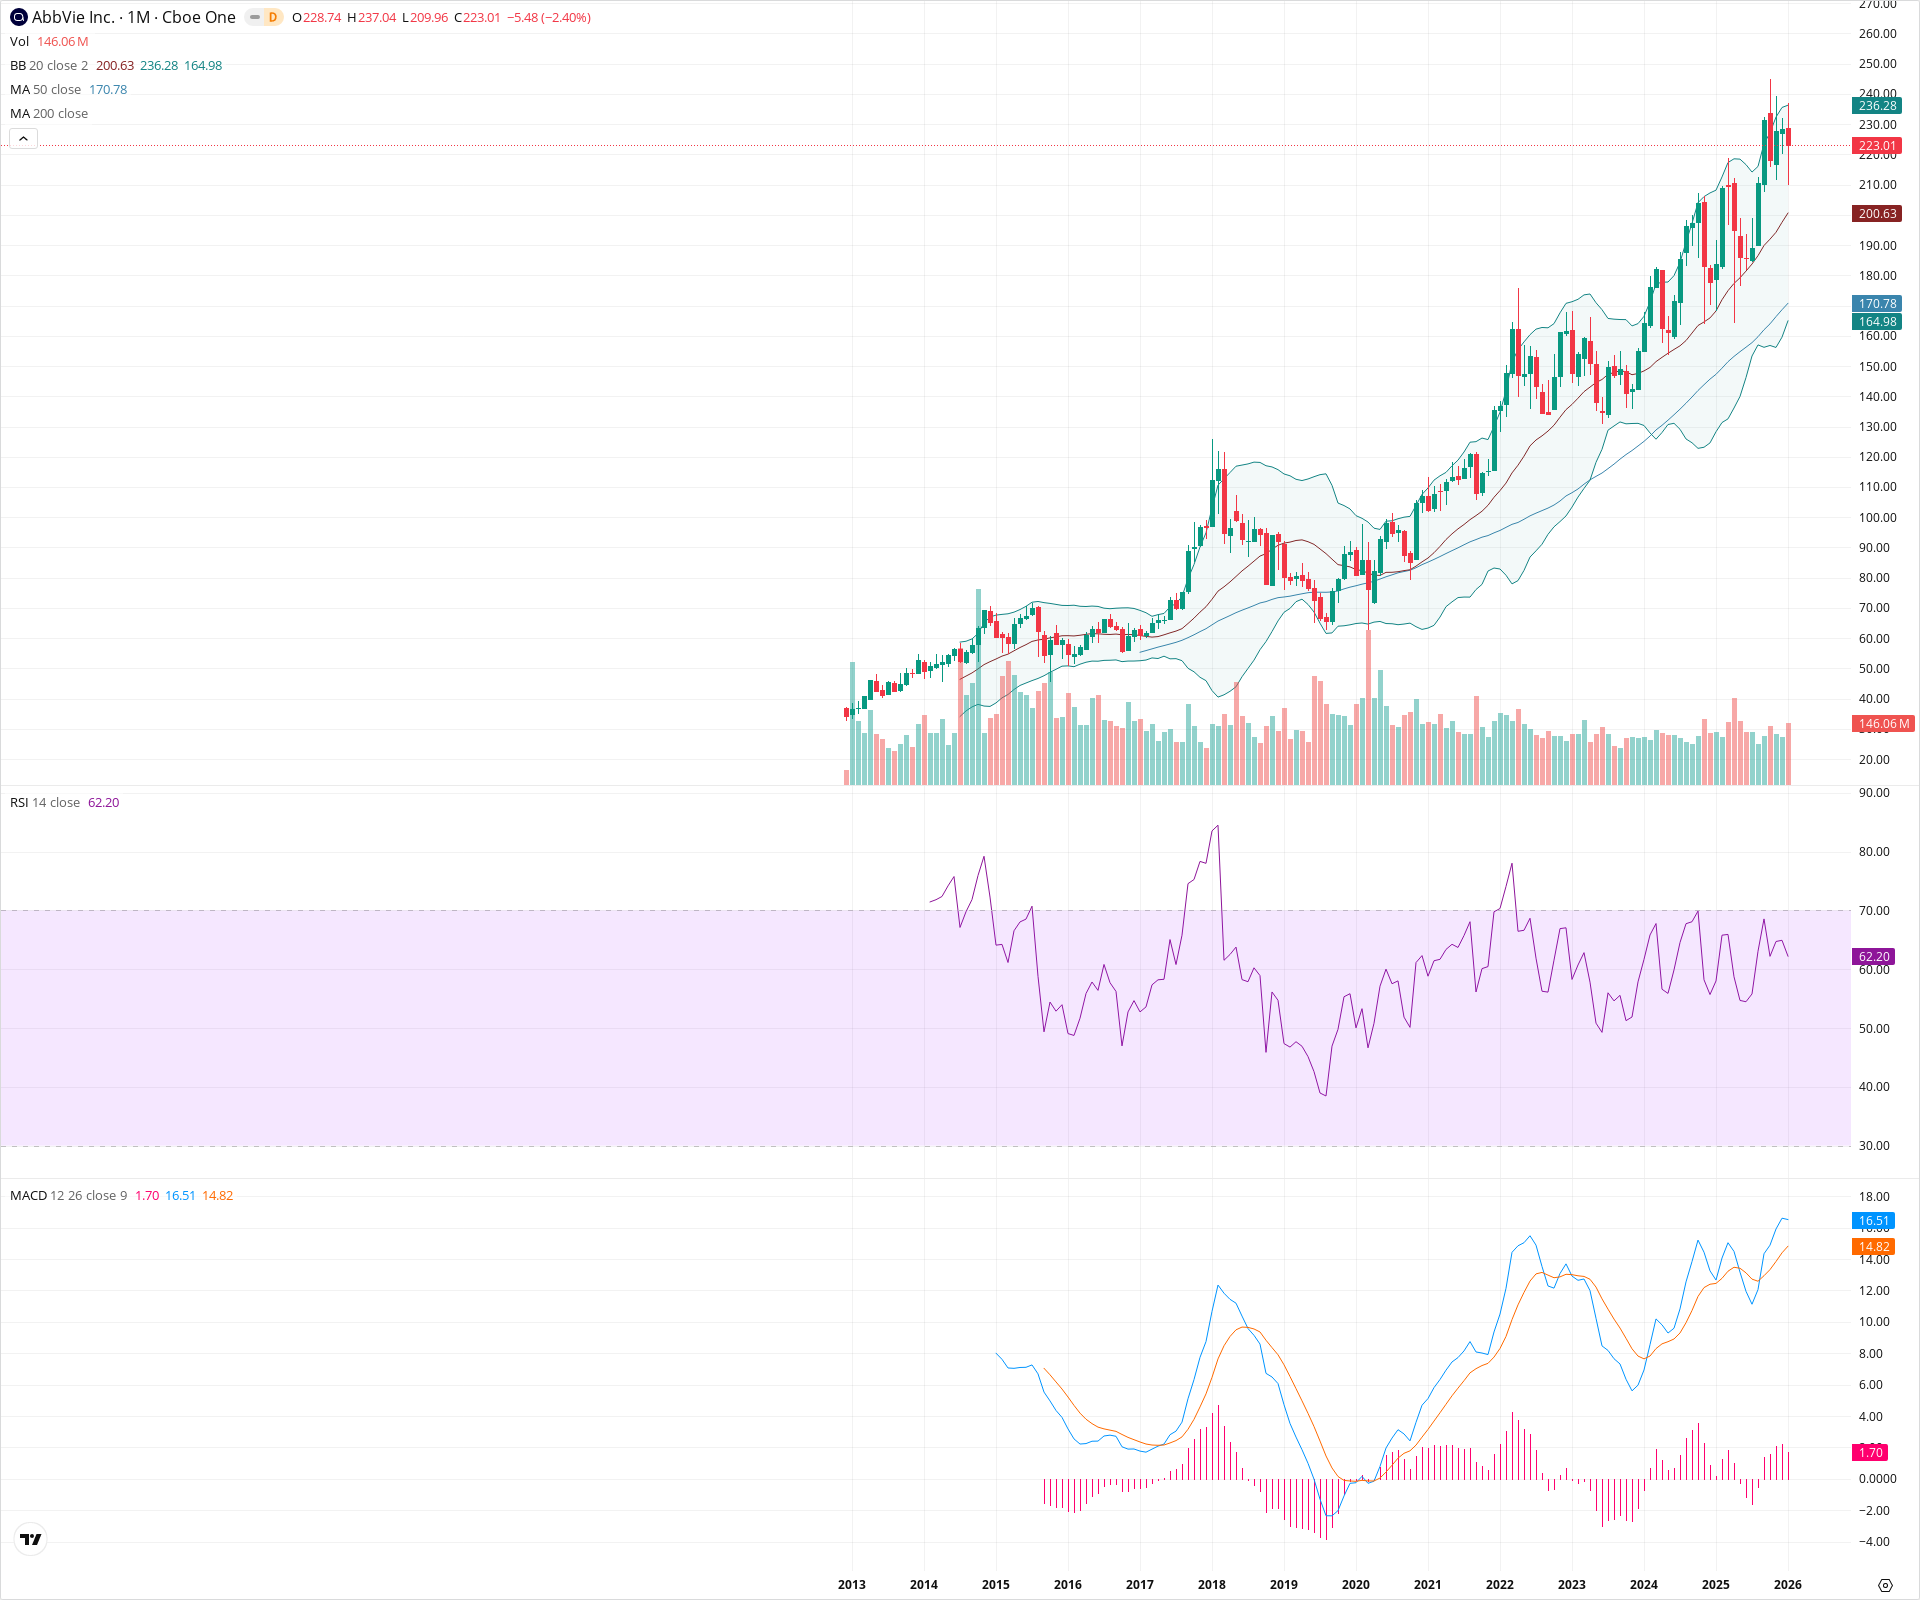
Sentiment
Short-term Sentiment (days to weeks): Bullish
Price remains near all-time highs despite a minor monthly pullback. RSI is in a healthy bullish zone (approx 62) and price is trading well above the middle Bollinger Band.
Long-term Sentiment (weeks to months): Bullish
The chart exhibits a strong secular uptrend with price effectively discovering new highs. The 20-month and 50-month SMAs are steeply rising and aligned, and the monthly MACD confirms strong positive momentum above the zero line.
Report Metadata
- Timeframe: monthly
- Generated at: 2026-02-02T05:10:31.911Z
- Model: gemini-3-pro-preview
Support Price Levels
| Level | Range | Strength | Notes |
|---|---|---|---|
| $200.50 | $200.00 - $201.00 | Strong | Coincides with the 20-month SMA (Middle Bollinger Band) and psychological round number. |
| $172.50 | $170.00 - $175.00 | Strong | Major structural support formed by the 2022 highs (previous resistance) and the rising 50-month SMA. |
| $137.00 | $134.00 - $140.00 | Strong | Base of the 2023 consolidation before the current breakout rally. |
Resistance Price Levels
| Level | Range | Strength | Notes |
|---|---|---|---|
| $238.50 | $237.00 - $240.00 | Strong | Current All-Time High (ATH) and immediate overhead ceiling. |
Potential Chart Patterns in Formation
| Strength | Pattern | Signal | Target | Details |
|---|---|---|---|---|
| Strong | Secular Breakout | Bullish | N/A | Price broke out from a multi-year consolidation range (approx $135-$175) in late 2023 and has continued to trend vertically. |
Frequently Asked Questions about ABBV
What is the current sentiment for ABBV?
The short-term sentiment for ABBV is currently Bullish because Price remains near all-time highs despite a minor monthly pullback. RSI is in a healthy bullish zone (approx 62) and price is trading well above the middle Bollinger Band.. The long-term trend is classified as Bullish.
What are the key support levels for ABBV?
StockDips.AI has identified key support levels for ABBV at $200.50 and $172.50. These levels may represent potential accumulation zones where buying interest could emerge.
Is ABBV in a significant dip or a Value Dip right now?
ABBV has a Value Score of 35/100. It is not currently flagged as a significant dip in the Top Dips list. It is not listed as a Value Dip because the long-term sentiment or value-score threshold does not qualify.
View the full interactive analysis on StockDips.AI.