AMC Monthly Technical Analysis
AMC Entertainment Holdings, Inc.
Largest U.S. movie-theater chain, widely known as a high-volatility meme stock with strong retail trader attention.
AMC Technical Analysis Summary
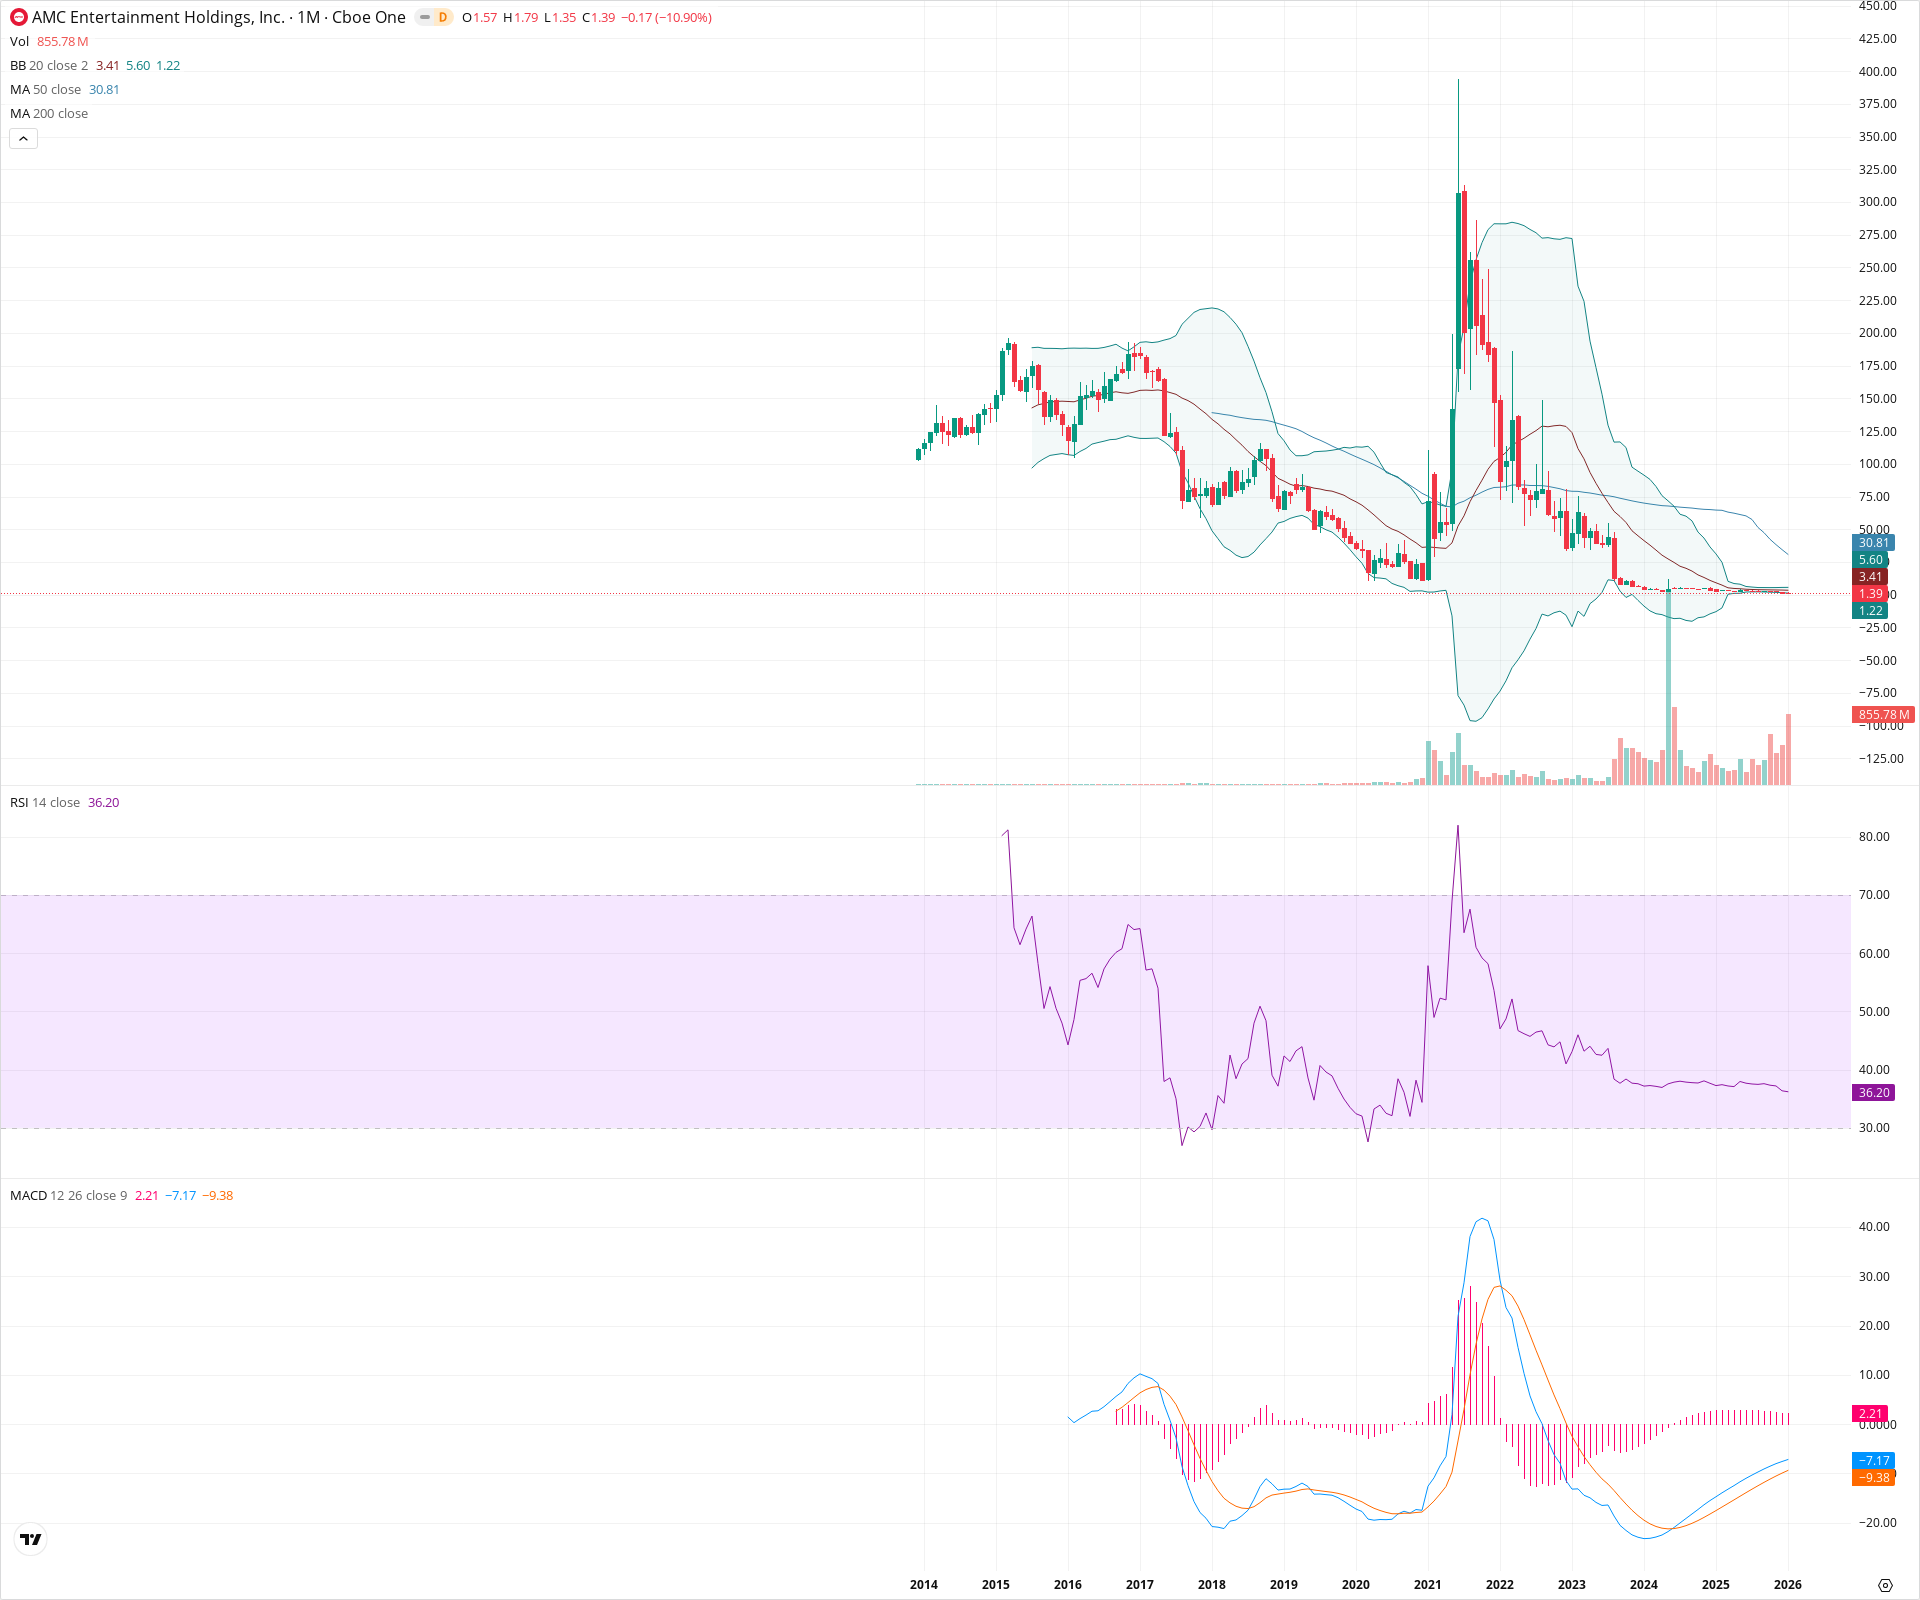
AMC remains in a confirmed secular bear market, trading near historical lows and well below all key long-term moving averages. While the MACD histogram shows diminishing downward momentum, price action has yet to confirm a reversal, and the RSI remains in weak territory. The extreme compression of the Bollinger Bands suggests a volatility expansion is likely approaching, but the prevailing trend favors the downside until resistance at the 20-month SMA is reclaimed.
Included In Lists
Related Tickers of Interest
AMC Monthly Chart
Sentiment
Short-term Sentiment (days to weeks): Bearish
Price is trading below the 20-period SMA and near the lower Bollinger Band, with the current monthly candle showing negative momentum (-10.90%).
Long-term Sentiment (weeks to months): Bearish
The stock is in a profound secular downtrend, trading significantly below the 50-month and 200-month moving averages, having erased nearly all gains from the 2021 peak.
Report Metadata
- Timeframe: monthly
- Generated at: 2026-02-02T05:10:41.011Z
- Model: gemini-3-pro-preview
Support Price Levels
| Level | Range | Strength | Notes |
|---|---|---|---|
| $1.29 | $1.22 - $1.35 | Weak | Confluence of the Lower Bollinger Band and current monthly lows; breaking this leads to price discovery. |
| $1.00 | $1.00 - $1.00 | Weak | Psychological round number support below current all-time adjusted lows. |
Resistance Price Levels
| Level | Range | Strength | Notes |
|---|---|---|---|
| $3.46 | $3.41 - $3.50 | Strong | 20-month SMA and Bollinger Band basis; nearest major dynamic resistance. |
| $5.80 | $5.60 - $6.00 | Strong | Upper Bollinger Band and previous consolidation zone. |
| $30.91 | $30.81 - $31.00 | Strong | 50-month SMA representing the long-term trend ceiling. |
Potential Chart Patterns in Formation
| Strength | Pattern | Signal | Target | Details |
|---|---|---|---|---|
| Strong | Secular Downtrend | Bearish | N/A | A multi-year pattern of lower highs and lower lows following the 2021 parabolic spike. |
| Weak | Volatility Compression | Neutral | N/A | Bollinger Bands have narrowed significantly compared to historical width, indicating a period of dormancy and potential for a volatility expansion. |
Frequently Asked Questions about AMC
What is the current sentiment for AMC?
The short-term sentiment for AMC is currently Bearish because Price is trading below the 20-period SMA and near the lower Bollinger Band, with the current monthly candle showing negative momentum (-10.90%).. The long-term trend is classified as Bearish.
What are the key support levels for AMC?
StockDips.AI has identified key support levels for AMC at $1.29 and $1.00. These levels may represent potential accumulation zones where buying interest could emerge.
Is AMC in a significant dip or a Value Dip right now?
AMC has a Value Score of 40/100. It is not currently flagged as a significant dip in the Top Dips list. It is not listed as a Value Dip because the long-term sentiment or value-score threshold does not qualify.
View the full interactive analysis on StockDips.AI.