BKKT Monthly Technical Analysis
Bakkt Holdings, Inc
A financial technology company that operates a digital asset platform.
BKKT Technical Analysis Summary
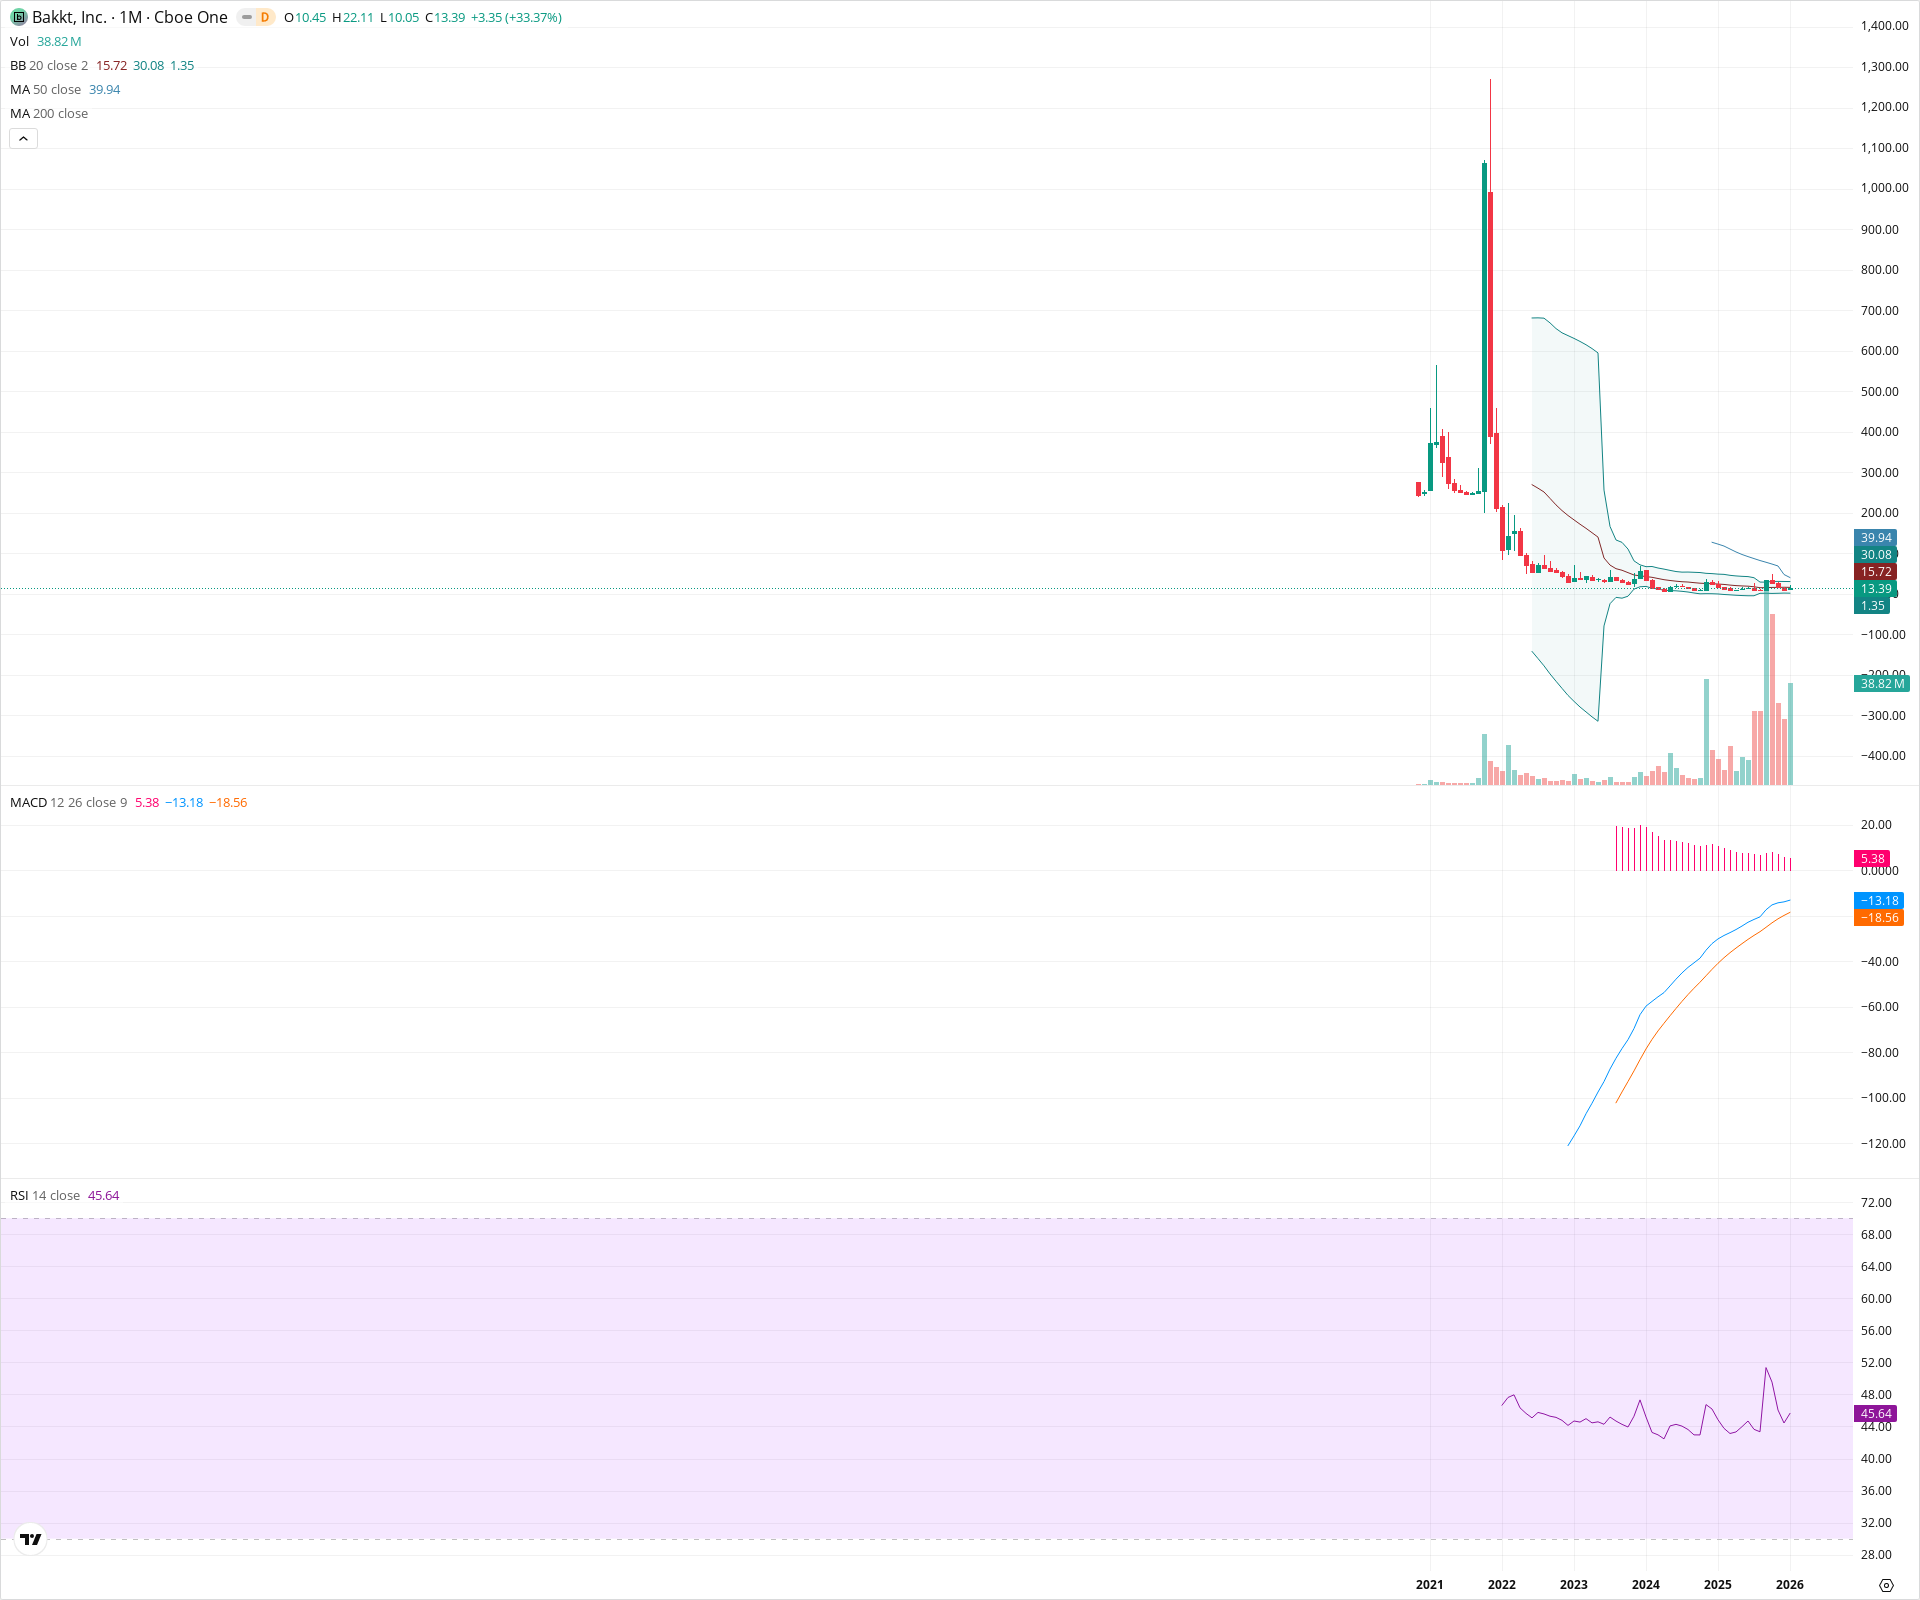
Bakkt is attempting to emerge from a prolonged accumulation phase after a massive historical drawdown. While short-term momentum is improving with a bullish MACD crossover and increased volume, the price faces stiff dynamic resistance at the 20-month SMA (15.72) and remains in a long-term bear market below the 50-month SMA. A sustained close above the 20-month SMA is required to validate a structural reversal.
Included In Lists
Related Tickers of Interest
BKKT Monthly Chart
Sentiment
Short-term Sentiment (days to weeks): Bullish
Recent price action shows a significant monthly gain (+33.37%) accompanied by a bullish MACD crossover and rising volume, indicating renewed momentum from the lows.
Long-term Sentiment (weeks to months): Bearish
The stock remains in a deep secular downtrend, trading well below the 50-month SMA and approximately 99% below its historical highs.
Report Metadata
- Timeframe: monthly
- Generated at: 2026-02-02T05:32:12.511Z
- Model: gemini-3-pro-preview
Support Price Levels
| Level | Range | Strength | Notes |
|---|---|---|---|
| $10.25 | $10.05 - $10.45 | Weak | Current monthly low and open; immediate support zone for the current breakout attempt. |
| $3.18 | $1.35 - $5.00 | Strong | Historical secular floor indicated by the Lower Bollinger Band and multi-year consolidation lows. |
Resistance Price Levels
| Level | Range | Strength | Notes |
|---|---|---|---|
| $18.92 | $15.72 - $22.11 | Strong | Zone defined by the 20-month SMA (Bollinger Basis) and the current month's high, where price was rejected. |
| $39.97 | $39.94 - $40.00 | Strong | The 50-month SMA acts as the primary secular trend resistance. |
Potential Chart Patterns in Formation
| Strength | Pattern | Signal | Target | Details |
|---|---|---|---|---|
| Weak | Secular Consolidation Base | Bullish | $39.94 | After a catastrophic decline, price has flatlined for over 18 months, forming a potential accumulation base or rounding bottom. |
Frequently Asked Questions about BKKT
What is the current sentiment for BKKT?
The short-term sentiment for BKKT is currently Bullish because Recent price action shows a significant monthly gain (+33.37%) accompanied by a bullish MACD crossover and rising volume, indicating renewed momentum from the lows.. The long-term trend is classified as Bearish.
What are the key support levels for BKKT?
StockDips.AI has identified key support levels for BKKT at $10.25 and $3.18. These levels may represent potential accumulation zones where buying interest could emerge.
Is BKKT in a significant dip or a Value Dip right now?
BKKT has a Value Score of 66/100. It is not currently flagged as a significant dip in the Top Dips list. It is not listed as a Value Dip because the long-term sentiment or value-score threshold does not qualify.
View the full interactive analysis on StockDips.AI.