BRK.B Daily Technical Analysis
Berkshire Hathaway
A diversified global conglomerate spanning insurance, railroads, energy, and consumer brands.
BRK.B Technical Analysis Summary
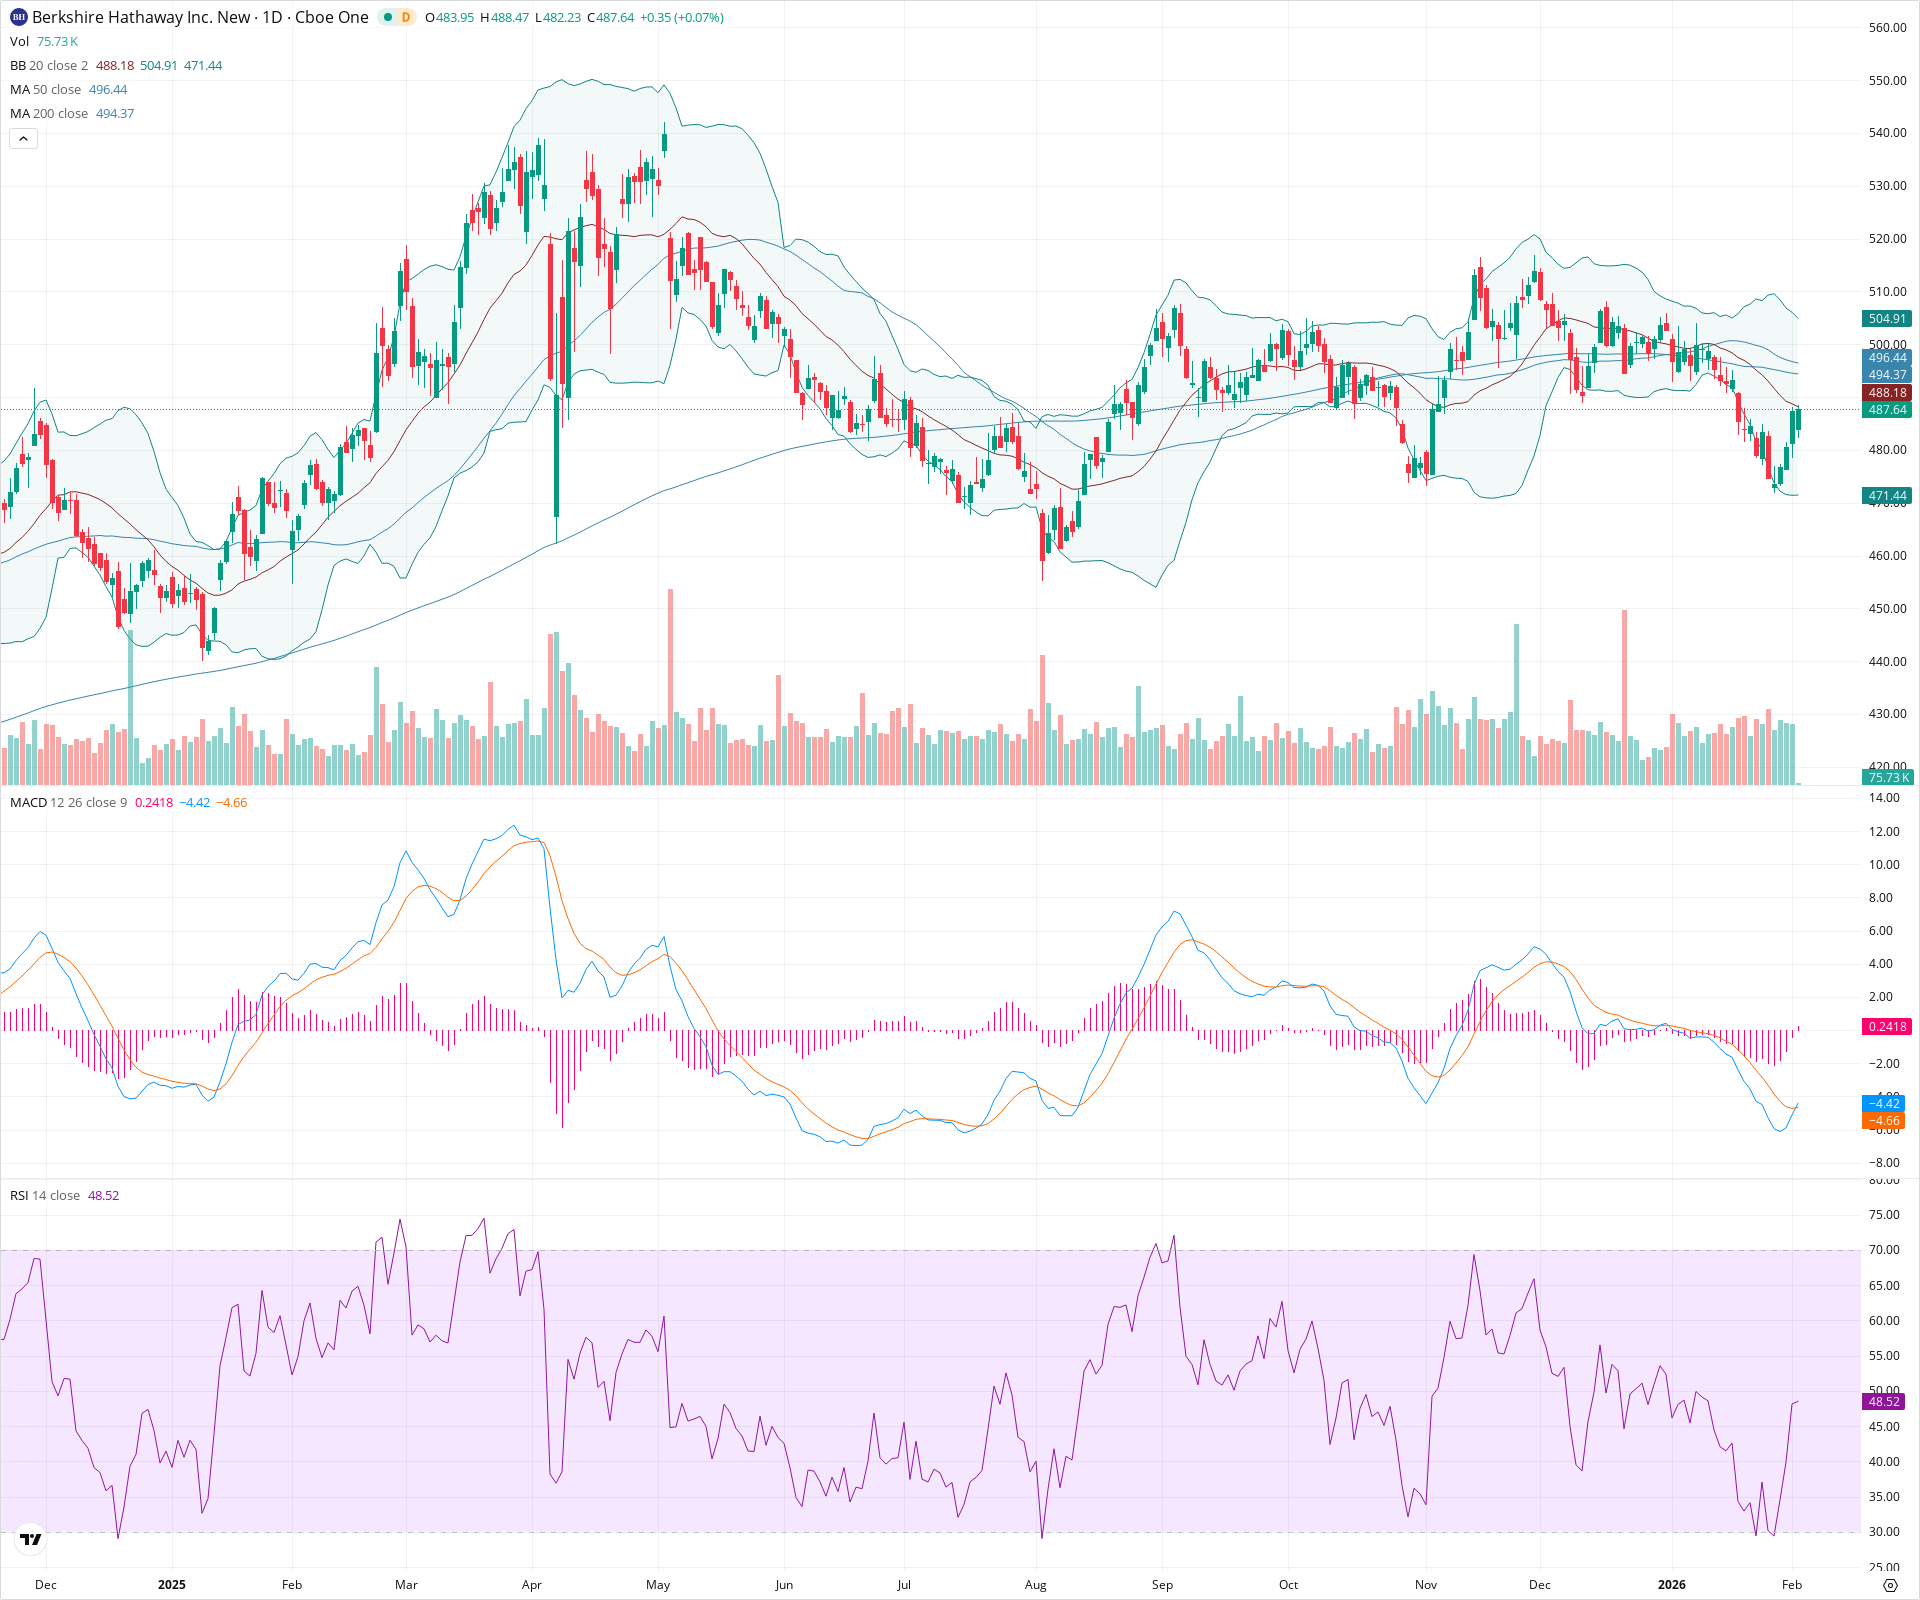
BRK.B is currently in a corrective phase, having broken below key structural support and the 200-day Moving Average. While short-term indicators like MACD show a momentum shift favoring a bounce, the price faces formidable resistance at the 488-496 zone (confluence of 20, 50, and 200 SMAs). Unless the stock can reclaim the 496 level, the path of least resistance remains downward towards the 450-460 target.
Included In Lists
Related Tickers of Interest
BRK.B Daily Chart
Sentiment
Short-term Sentiment (days to weeks): Neutral
Price is staging a relief rally from recent lows with RSI rising back to 50 and a fresh MACD bullish crossover, but it remains capped by the 20-day SMA resistance.
Long-term Sentiment (weeks to months): Bearish
The stock is trading below both the 50-day and 200-day SMAs, signaling a disruption in the long-term uptrend. The 50-day SMA is converging toward the 200-day SMA, suggesting weakening structural momentum.
Report Metadata
- Timeframe: daily
- Generated at: 2026-02-03T15:04:21.518Z
- Model: gemini-3-pro-preview
Support Price Levels
| Level | Range | Strength | Notes |
|---|---|---|---|
| $471.00 | $470.00 - $472.00 | Strong | Recent swing low coinciding with the lower Bollinger Band. |
| $457.50 | $455.00 - $460.00 | Weak | Historical support zone from August/September consolidation. |
Resistance Price Levels
| Level | Range | Strength | Notes |
|---|---|---|---|
| $488.50 | $488.00 - $489.00 | Strong | Immediate resistance at the 20-day SMA and previous breakdown level. |
| $495.50 | $494.00 - $497.00 | Strong | Major confluence zone of the 200-day SMA (494.37) and 50-day SMA (496.44). |
| $505.00 | $504.00 - $506.00 | Weak | Upper Bollinger Band and recent swing highs. |
Potential Chart Patterns in Formation
| Strength | Pattern | Signal | Target | Details |
|---|---|---|---|---|
| Strong | Head and Shoulders (Breakdown & Retest) | Bearish | $450.00 | A head and shoulders top pattern appears to have completed with the neckline break around 480. The current price action represents a retest of this breakdown zone and the overhead Moving Averages. |
| Weak | Bearish Flag / Relief Rally | Bearish | N/A | The recent bounce from 470 on lighter volume resembles a bearish consolidation or flag pattern before a potential continuation of the downtrend. |
Frequently Asked Questions about BRK.B
What is the current sentiment for BRK.B?
The short-term sentiment for BRK.B is currently Neutral because Price is staging a relief rally from recent lows with RSI rising back to 50 and a fresh MACD bullish crossover, but it remains capped by the 20-day SMA resistance.. The long-term trend is classified as Bearish.
What are the key support levels for BRK.B?
StockDips.AI has identified key support levels for BRK.B at $471.00 and $457.50. These levels may represent potential accumulation zones where buying interest could emerge.
Is BRK.B in a significant dip or a Value Dip right now?
BRK.B has a Value Score of -36/100. It is currently flagged as a significant dip in the Top Dips list. It is not listed as a Value Dip because the long-term sentiment or value-score threshold does not qualify.
View the full interactive analysis on StockDips.AI.