V Daily Technical Analysis
Visa
World’s leading digital payments network enabling global card transactions.
V Technical Analysis Summary
Visa (V) has undergone a dramatic bullish trend reversal over the last few months, staging a massive rally from lows near 300. Currently, the stock is experiencing a healthy and expected short-term technical pullback from overbought conditions, confirmed by bearish momentum in the MACD and RSI. However, the long-term technical picture remains strongly bullish, with price situated comfortably above rising key moving averages. Investors should watch for the current consolidation to find strong support in the 335-350 zones to establish a higher low before the primary uptrend resumes.
Included In Lists
Related Tickers of Interest
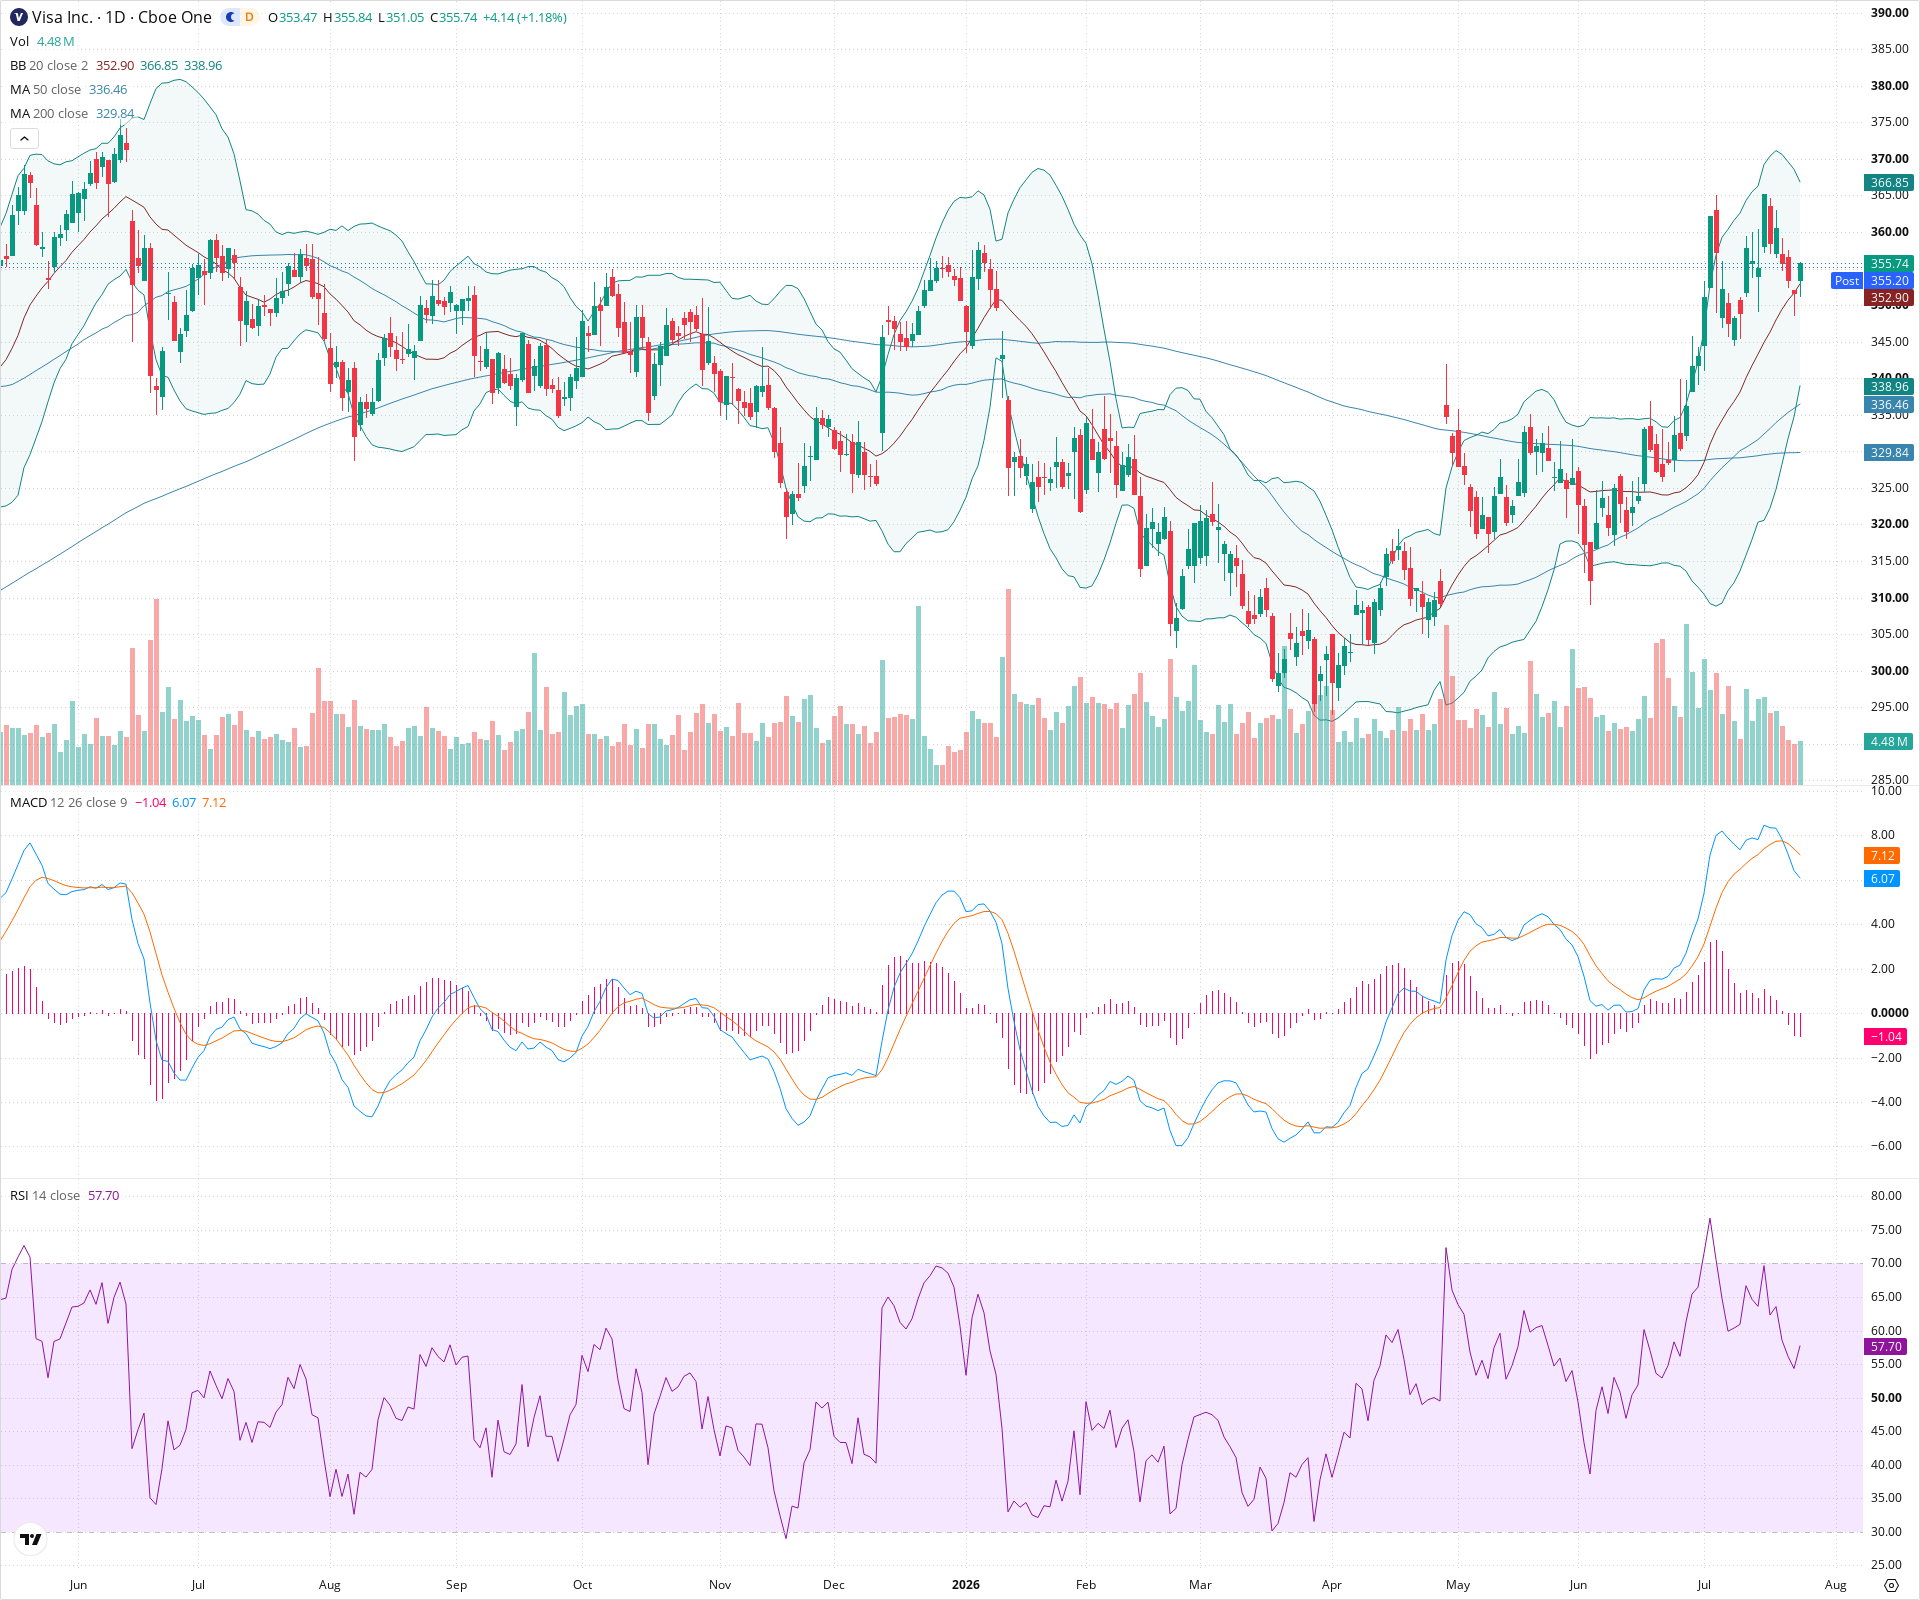
V Daily Chart
Sentiment
Short-term Sentiment (days to weeks): Bearish
Price has pulled back sharply from recent highs near 370, dropping back inside the Bollinger Bands. Short-term momentum is negative, evidenced by a clear bearish MACD crossover with an expanding negative histogram, and RSI dropping sharply from overbought levels towards neutral territory.
Long-term Sentiment (weeks to months): Bullish
The long-term market structure remains decisively bullish following a massive reversal from the 300 level. Price remains well above a rising 50-day SMA and a flat-to-rising 200-day SMA, indicating the broader primary trend is upward despite the current near-term correction.
Report Metadata
- Timeframe: daily
- Generated at: 2026-07-24T21:04:22.101Z
- Model: gemini-3.1-pro-preview
Support Price Levels
| Level | Range | Strength | Notes |
|---|---|---|---|
| $348.00 | $345.00 - $351.00 | Strong | Recent swing low zone and minor consolidation area establishing initial support during the current pullback. |
| $337.50 | $335.00 - $340.00 | Strong | Confluence of the rising 50-day SMA (currently ~336) and a previous structural resistance zone that should act as strong support on a retest. |
| $327.50 | $325.00 - $330.00 | Strong | Major structural breakout level and convergence area of the 200-day SMA (~329), serving as critical long-term support. |
Resistance Price Levels
| Level | Range | Strength | Notes |
|---|---|---|---|
| $368.50 | $365.00 - $372.00 | Strong | Recent significant swing high where the vertical rally lost momentum and heavy selling volume was observed. |
| $382.50 | $380.00 - $385.00 | Strong | Major historical swing high visible on the far left of the chart. |
Potential Chart Patterns in Formation
| Strength | Pattern | Signal | Target | Details |
|---|---|---|---|---|
| Weak | Bullish Flag (Forming) | Bullish | N/A | The rapid, near-vertical ascent from ~320 to ~370 forms a flagpole. The current downward-sloping, choppy price action represents the flag, acting as a consolidation phase to digest recent gains and reset overbought indicators. |
Frequently Asked Questions about V
What is the current sentiment for V?
The short-term sentiment for V is currently Bearish because Price has pulled back sharply from recent highs near 370, dropping back inside the Bollinger Bands. Short-term momentum is negative, evidenced by a clear bearish MACD crossover with an expanding negative histogram, and RSI dropping sharply from overbought levels towards neutral territory.. The long-term trend is classified as Bullish.
What are the key support levels for V?
StockDips.AI has identified key support levels for V at $348.00 and $337.50. These levels may represent potential accumulation zones where buying interest could emerge.
Is V in a significant dip or a Value Dip right now?
V has a Value Score of 63/100. It is not currently flagged as a significant dip in the Top Dips list. It is not listed as a Value Dip because the long-term sentiment or value-score threshold does not qualify.
View the full interactive analysis on StockDips.AI.