CPER Daily Technical Analysis
United States Copper Index Fund
Provides exposure to copper futures prices. Copper is a critical industrial metal used in construction, manufacturing, renewable energy, and electric vehicles. Often called “Dr. Copper” due to its ability to signal global economic strength or weakness.
CPER Technical Analysis Summary
CPER remains in a primary long-term uptrend, indicated by the favorable alignment of its major moving averages. However, for the past several months, the asset has been locked in a sideways consolidation phase, forming a symmetrical triangle pattern. Investors should watch for a decisive volume-backed breakout from this tightening range to signal the next major directional move.
Included In Lists
Related Tickers of Interest
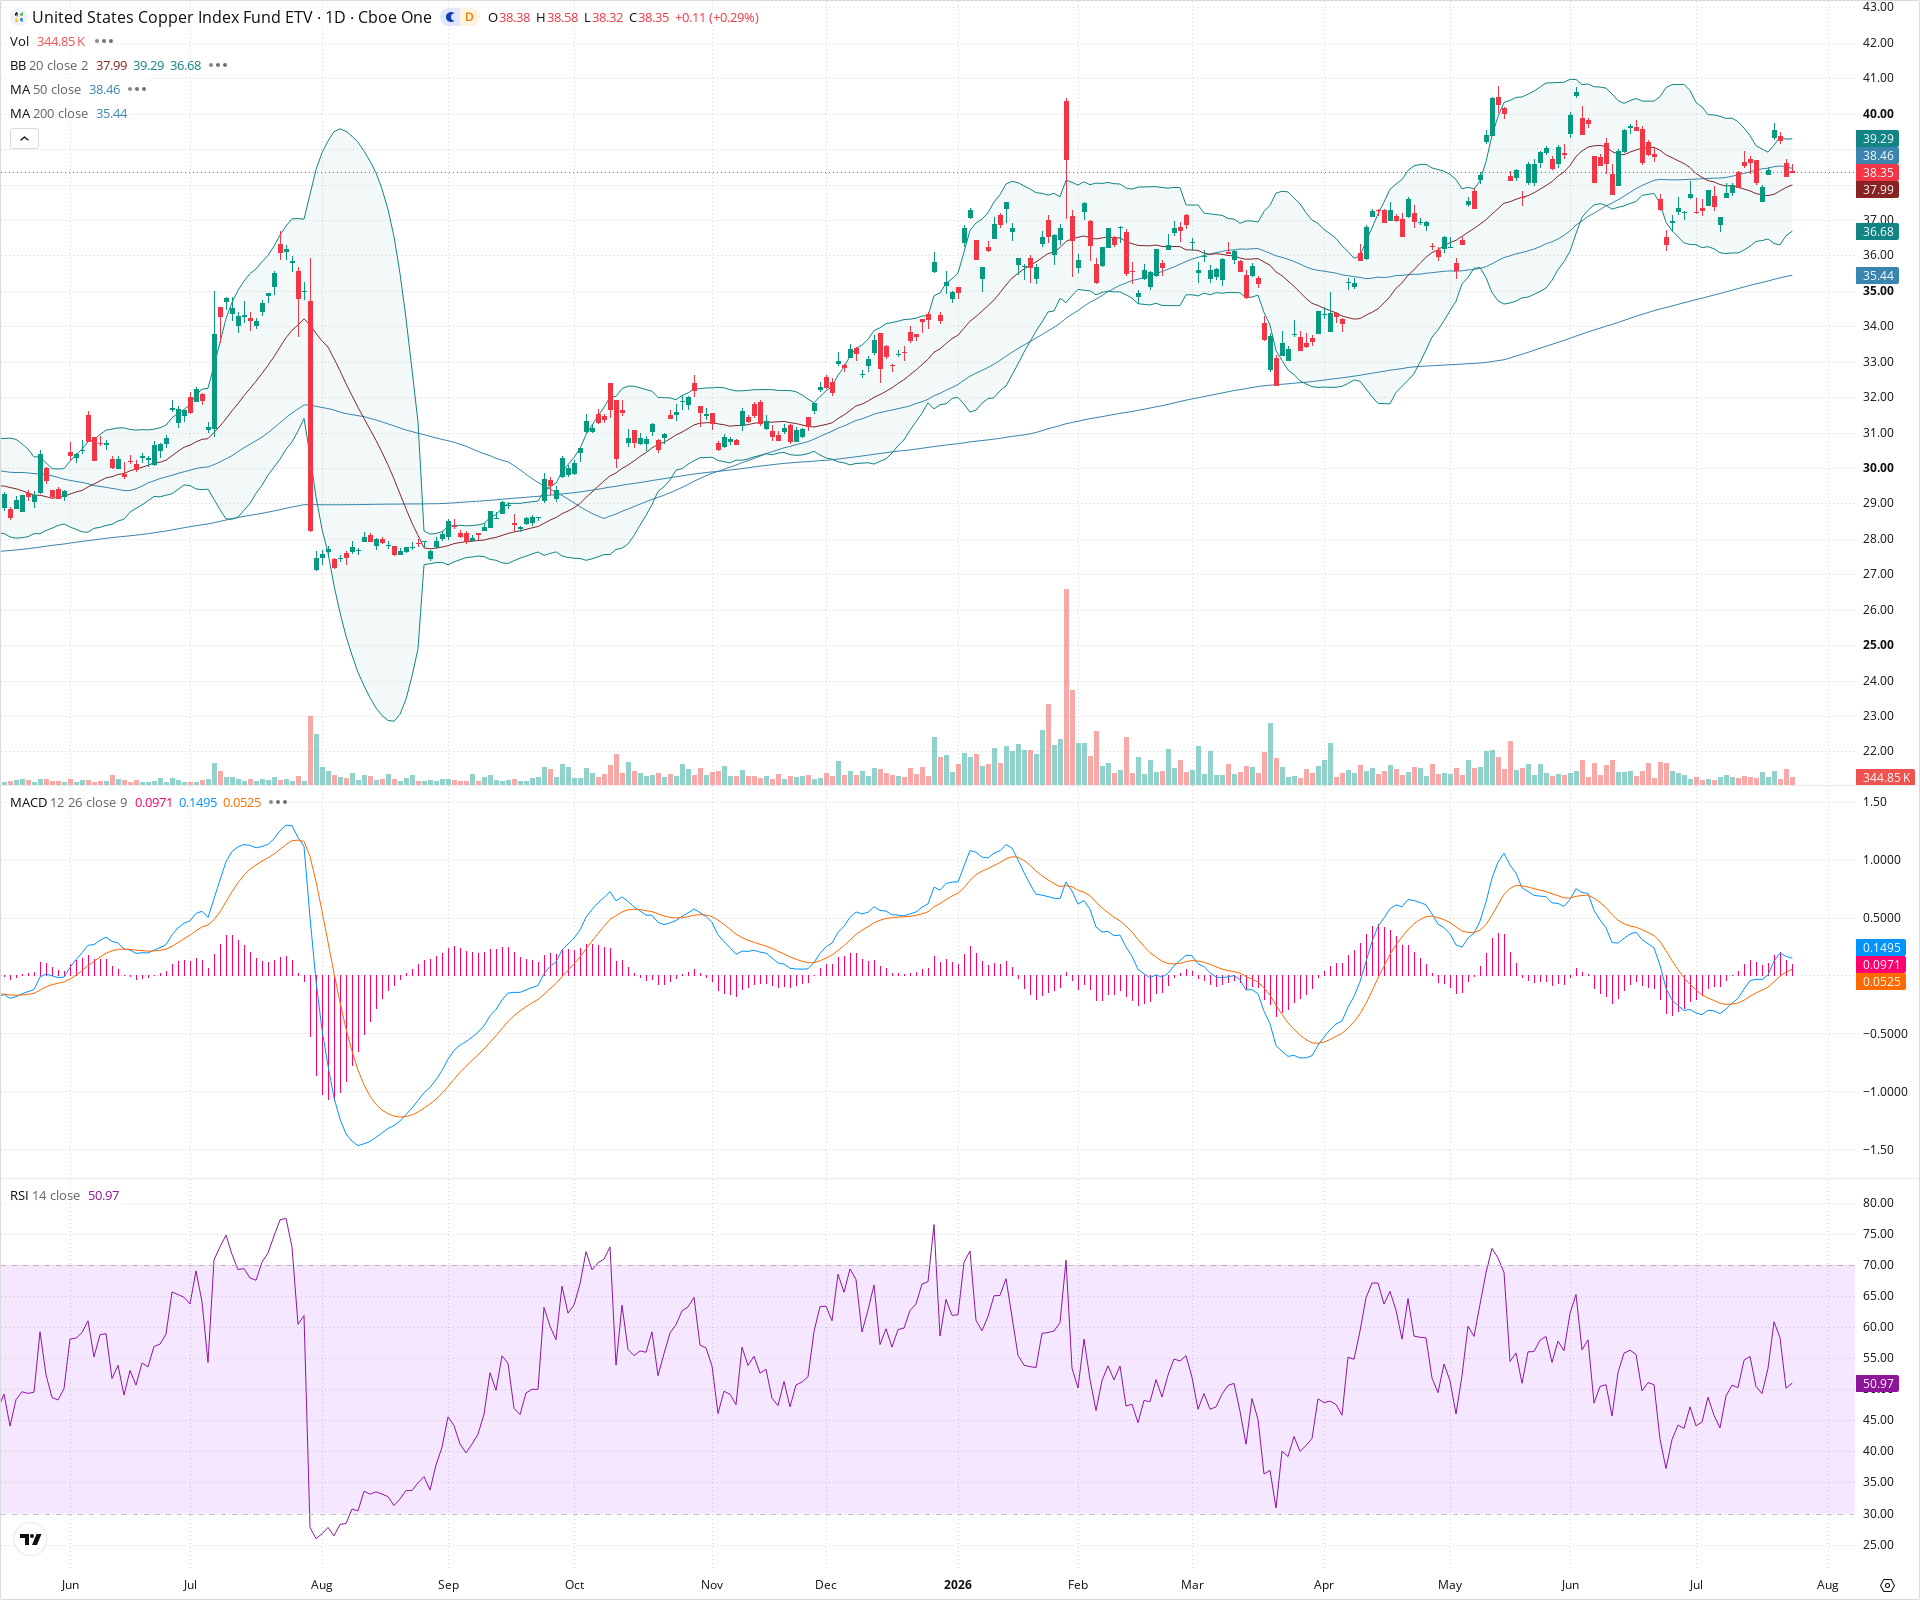
CPER Daily Chart
Sentiment
Short-term Sentiment (days to weeks): Neutral
Price is consolidating sideways, hovering tightly around the flat 20-day and 50-day moving averages. Momentum indicators are flat, with RSI sitting neutrally at ~51 and the MACD hovering just above the zero line with minimal histogram expansion.
Long-term Sentiment (weeks to months): Bullish
The broader trend remains upward, characterized by the 50-day moving average staying well above a rising 200-day moving average, and price maintaining levels significantly above the 200-day trendline despite recent months of consolidation.
Report Metadata
- Timeframe: daily
- Generated at: 2026-07-24T21:04:37.200Z
- Model: gemini-3.1-pro-preview
Support Price Levels
| Level | Range | Strength | Notes |
|---|---|---|---|
| $37.00 | $36.50 - $37.50 | Strong | Recent swing lows and area of lower Bollinger Band touches where price has consistently found buying pressure. |
| $35.25 | $35.00 - $35.50 | Strong | Major dynamic support zone aligning with the rising 200-day SMA and a previous horizontal consolidation base. |
Resistance Price Levels
| Level | Range | Strength | Notes |
|---|---|---|---|
| $39.75 | $39.50 - $40.00 | Strong | Recent series of lower highs forming the upper boundary of the current consolidation pattern. |
| $41.75 | $41.50 - $42.00 | Strong | The absolute peak established earlier in the year, representing major macro resistance. |
Potential Chart Patterns in Formation
| Strength | Pattern | Signal | Target | Details |
|---|---|---|---|---|
| Strong | Symmetrical Triangle | Neutral | N/A | Since peaking near 42, the price action has formed a series of lower highs and higher lows, creating a narrowing consolidation wedge structure. |
Frequently Asked Questions about CPER
What is the current sentiment for CPER?
The short-term sentiment for CPER is currently Neutral because Price is consolidating sideways, hovering tightly around the flat 20-day and 50-day moving averages. Momentum indicators are flat, with RSI sitting neutrally at ~51 and the MACD hovering just above the zero line with minimal histogram expansion.. The long-term trend is classified as Bullish.
What are the key support levels for CPER?
StockDips.AI has identified key support levels for CPER at $37.00 and $35.25. These levels may represent potential accumulation zones where buying interest could emerge.
Is CPER in a significant dip or a Value Dip right now?
CPER has a Value Score of 50/100. It is not currently flagged as a significant dip in the Top Dips list. It is not listed as a Value Dip because the long-term sentiment or value-score threshold does not qualify.
View the full interactive analysis on StockDips.AI.