GLD Daily Technical Analysis
SPDR Gold Shares
Tracks the spot price of physical gold bullion held in secure vaults. Roughly ~1/10 oz of gold per share. Often used as a hedge against inflation, currency debasement, geopolitical risk, and financial market stress. Gold is considered a store of value and tends to perform well during risk-off environments.
GLD Technical Analysis Summary
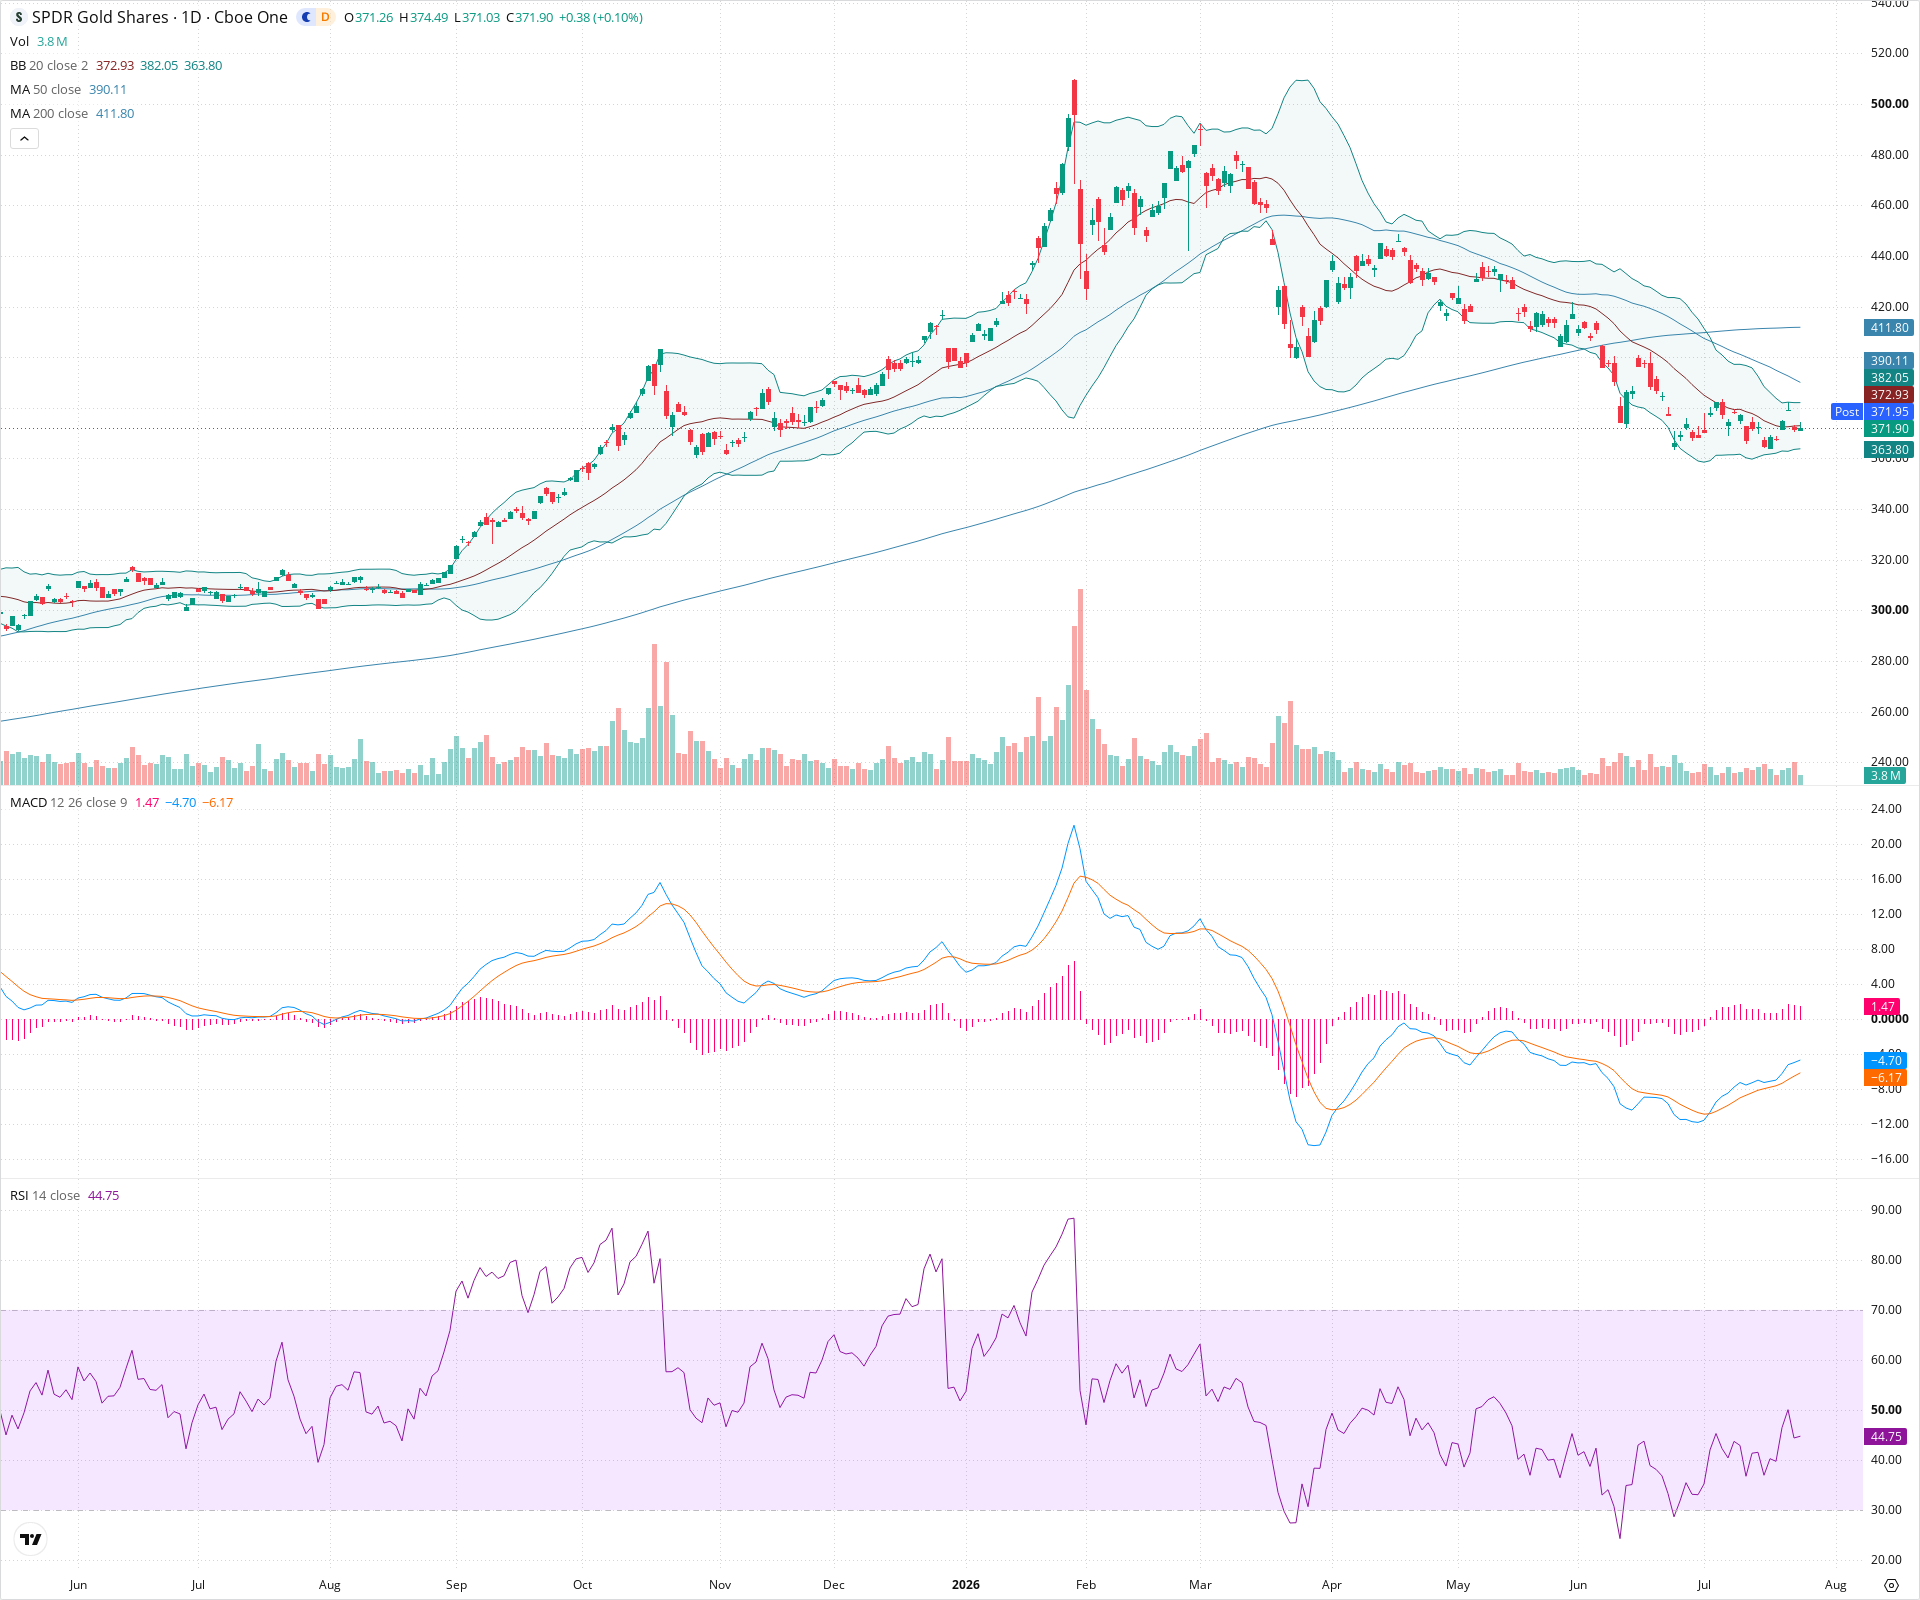
GLD remains entrenched in a dominant long-term downtrend following a significant peak, currently trading well below its major moving averages. In the short term, the asset is attempting to form a base and consolidate around the 360 level, with momentum indicators hinting at slowing bearish pressure. However, substantial overhead resistance from declining moving averages suggests long-term investors should remain cautious until a definitive change in market structure is observed.
Included In Lists
Related Tickers of Interest
GLD Daily Chart
Sentiment
Short-term Sentiment (days to weeks): Neutral
Price is consolidating near recent lows in a tight range. While a bullish MACD crossover and recovering RSI suggest waning downside momentum, price remains constrained beneath short-term moving averages.
Long-term Sentiment (weeks to months): Bearish
The chart exhibits a protracted downtrend characterized by lower highs and lower lows. The price is trading significantly below a flattening 200-day SMA, and the 50-day SMA is positioned below the 200-day SMA.
Report Metadata
- Timeframe: daily
- Generated at: 2026-07-24T21:05:40.699Z
- Model: gemini-3.1-pro-preview
Support Price Levels
| Level | Range | Strength | Notes |
|---|---|---|---|
| $362.50 | $360.00 - $365.00 | Strong | Recent multi-point swing low area where price has found structural support and bounced. |
| $325.00 | $320.00 - $330.00 | Weak | Historical consolidation zone from several months prior, before the major upward breakout. |
Resistance Price Levels
| Level | Range | Strength | Notes |
|---|---|---|---|
| $387.00 | $382.00 - $392.00 | Strong | Immediate overhead resistance zone encompassing recent lower highs and the declining 50-day SMA. |
| $415.00 | $410.00 - $420.00 | Strong | Significant structural resistance area that includes prior failed bounce levels and the 200-day SMA. |
Potential Chart Patterns in Formation
| Strength | Pattern | Signal | Target | Details |
|---|---|---|---|---|
| Weak | Potential Base / Double Bottom | Bullish | $420.00 | Price has tested the 360-365 support zone multiple times recently without breaking lower, attempting to form a foundation after a long downtrend. This is accompanied by bullish divergence signals in momentum indicators like the MACD crossover. |
Frequently Asked Questions about GLD
What is the current sentiment for GLD?
The short-term sentiment for GLD is currently Neutral because Price is consolidating near recent lows in a tight range. While a bullish MACD crossover and recovering RSI suggest waning downside momentum, price remains constrained beneath short-term moving averages.. The long-term trend is classified as Bearish.
What are the key support levels for GLD?
StockDips.AI has identified key support levels for GLD at $362.50 and $325.00. These levels may represent potential accumulation zones where buying interest could emerge.
Is GLD in a significant dip or a Value Dip right now?
GLD has a Value Score of 62/100. It is not currently flagged as a significant dip in the Top Dips list. It is not listed as a Value Dip because the long-term sentiment or value-score threshold does not qualify.
View the full interactive analysis on StockDips.AI.