CPER Monthly Technical Analysis
United States Copper Index Fund
Provides exposure to copper futures prices. Copper is a critical industrial metal used in construction, manufacturing, renewable energy, and electric vehicles. Often called “Dr. Copper” due to its ability to signal global economic strength or weakness.
CPER Technical Analysis Summary
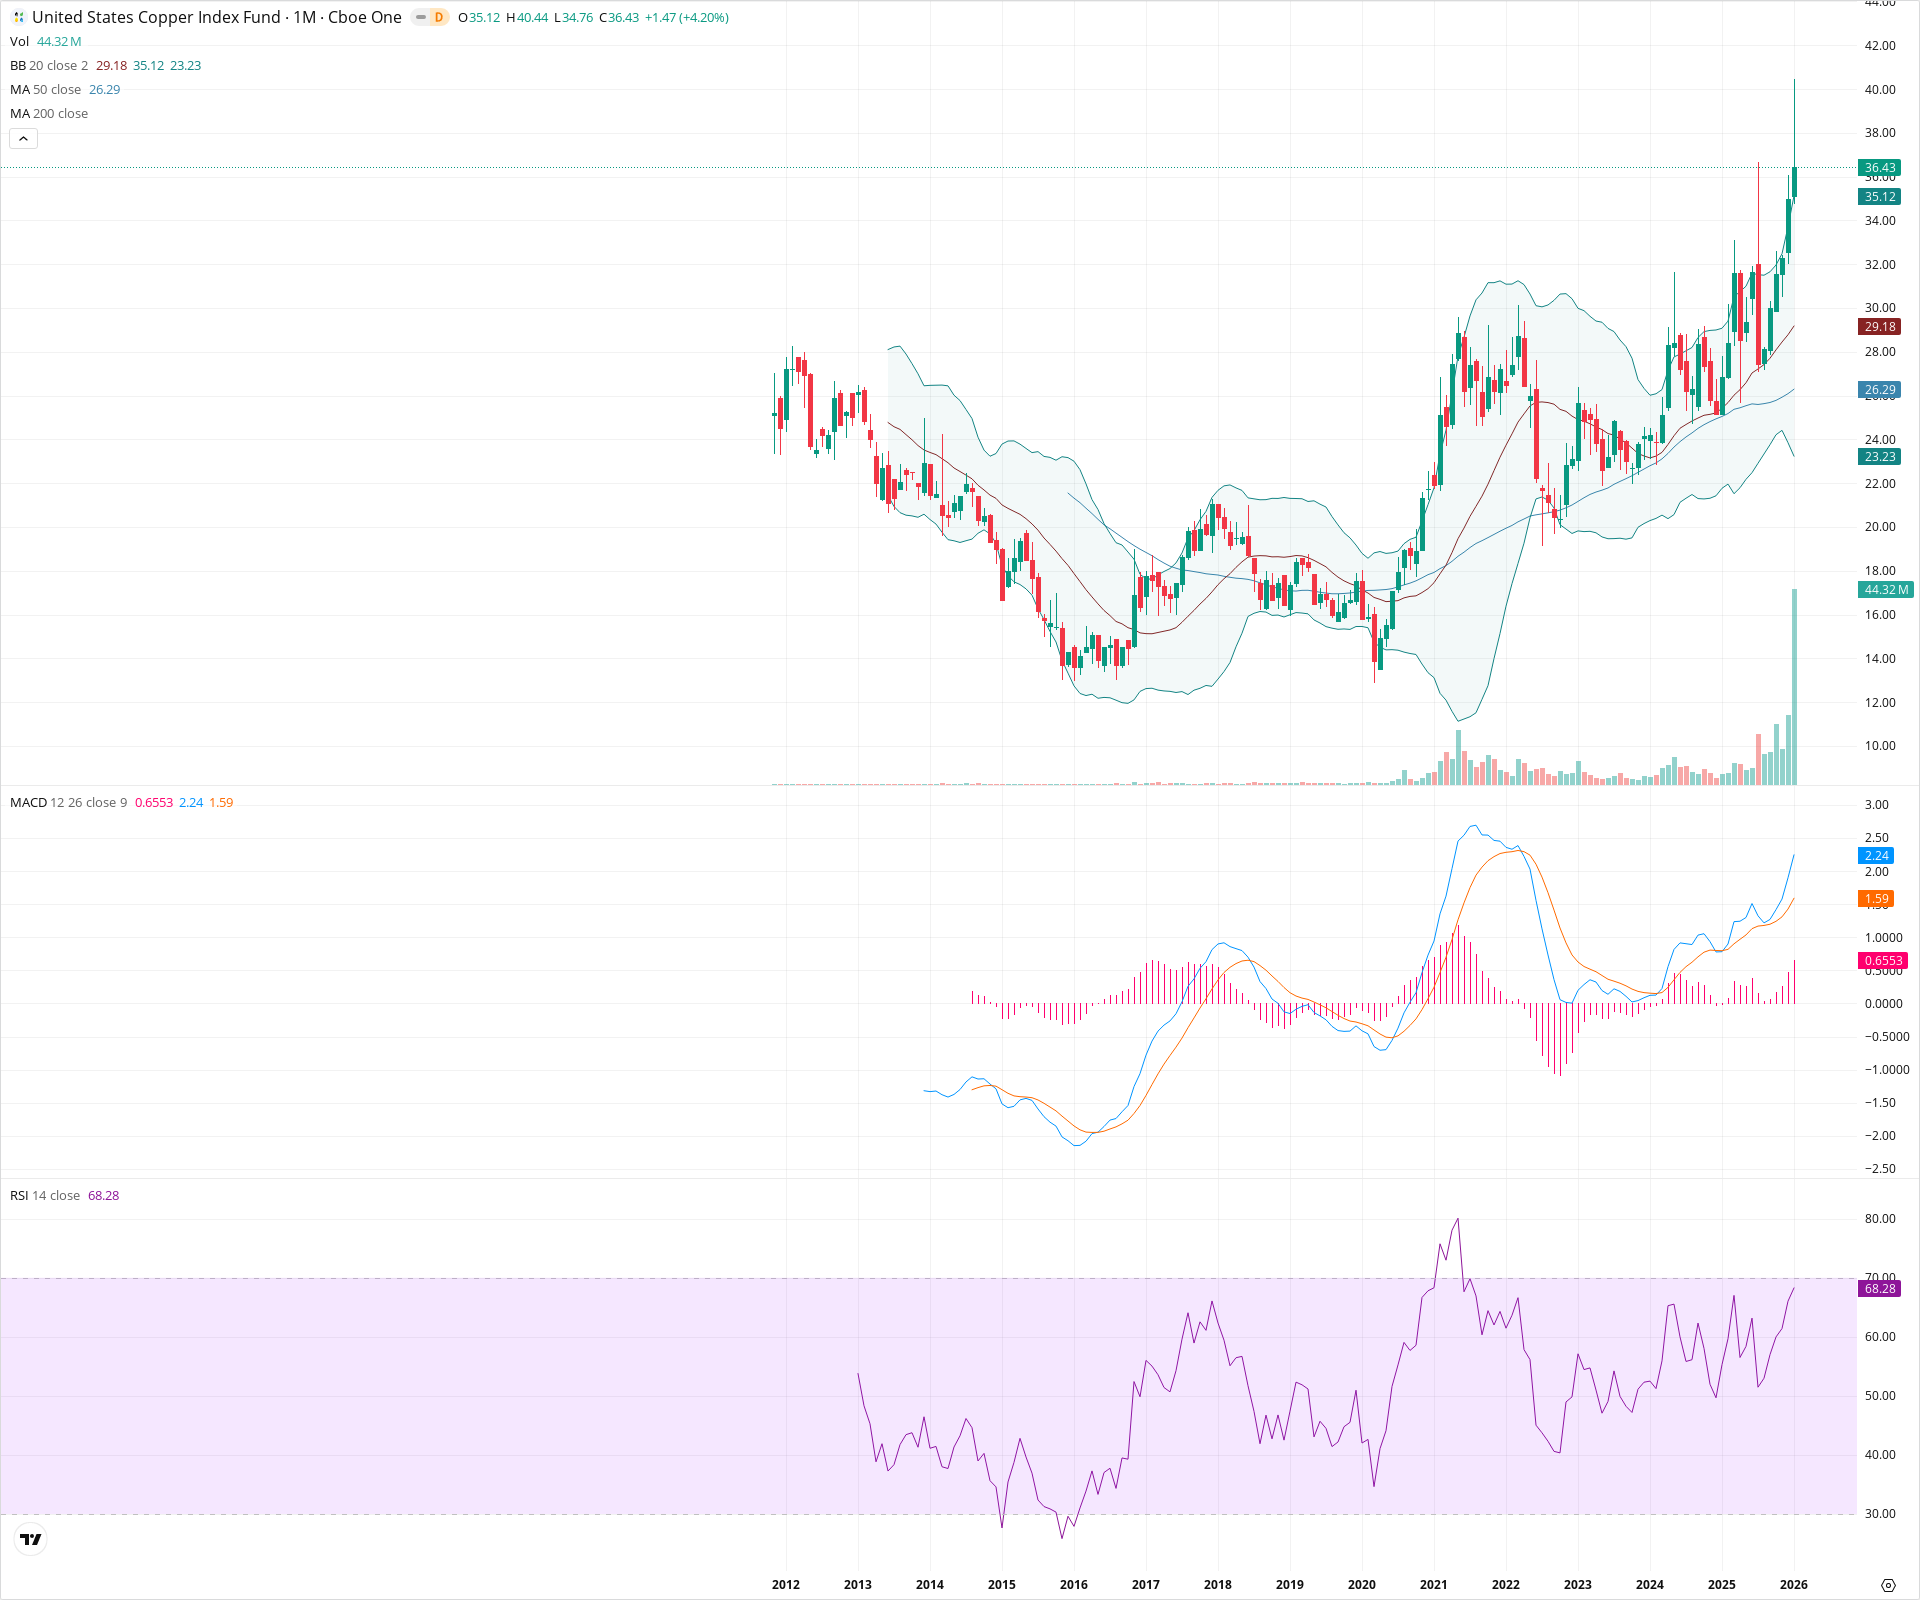
CPER has confirmed a major secular breakout by clearing the 29.00-30.00 resistance zone that capped prices for over a decade. The trend is strongly bullish with price expanding above the upper Bollinger Band and momentum indicators rising, though the current monthly candle's upper wick suggests profit-taking near 40.00. Long-term structure favors continuation towards higher targets as long as the 30.00 breakout level holds as support.
Included In Lists
Related Tickers of Interest
CPER Monthly Chart
Sentiment
Short-term Sentiment (days to weeks): Bullish
Price is trading well above the 20-month SMA and riding the Upper Bollinger Band, indicating strong momentum despite recent rejection from highs.
Long-term Sentiment (weeks to months): Bullish
The chart exhibits a major secular breakout above the 30.00 level, ending a decade-long consolidation, confirmed by bullish 20/50 SMA alignment and rising MACD.
Report Metadata
- Timeframe: monthly
- Generated at: 2026-02-02T07:17:24.813Z
- Model: gemini-3-pro-preview
Support Price Levels
| Level | Range | Strength | Notes |
|---|---|---|---|
| $29.84 | $29.18 - $30.50 | Strong | Confluence of the 20-month SMA and the previous multi-year resistance zone (2022 highs) now acting as support. |
| $26.25 | $26.00 - $26.50 | Strong | Location of the 50-month SMA providing structural trend support. |
Resistance Price Levels
| Level | Range | Strength | Notes |
|---|---|---|---|
| $40.22 | $40.00 - $40.44 | Strong | Recent swing high and psychological round number where significant selling pressure appeared (long upper wick). |
Potential Chart Patterns in Formation
| Strength | Pattern | Signal | Target | Details |
|---|---|---|---|---|
| Strong | Rounding Bottom / Saucer | Bullish | $48.00 | A massive multi-year base formation spanning from 2012 to 2024 with a neckline around the 30.00 level. |
Frequently Asked Questions about CPER
What is the current sentiment for CPER?
The short-term sentiment for CPER is currently Bullish because Price is trading well above the 20-month SMA and riding the Upper Bollinger Band, indicating strong momentum despite recent rejection from highs.. The long-term trend is classified as Bullish.
What are the key support levels for CPER?
StockDips.AI has identified key support levels for CPER at $29.84 and $26.25. These levels may represent potential accumulation zones where buying interest could emerge.
Is CPER in a significant dip or a Value Dip right now?
CPER has a Value Score of 51/100. It is not currently flagged as a significant dip in the Top Dips list. It is not listed as a Value Dip because the long-term sentiment or value-score threshold does not qualify.
View the full interactive analysis on StockDips.AI.