UNG Daily Technical Analysis
United States Natural Gas Fund
Tracks the price of natural gas futures contracts. Natural gas is used for electricity generation, heating, and industrial production. Prices are highly volatile and sensitive to weather patterns, storage levels, and seasonal demand.
UNG Technical Analysis Summary
UNG remains trapped in a persistent long-term downtrend, dominated by overhead moving averages and a lack of sustained buying pressure. Short-term momentum has recently deteriorated further, marked by a bearish MACD crossover and a breakdown from recent consolidation levels. The technical picture suggests a high probability of retesting major support in the $9.50-$10.00 region.
Included In Lists
Related Tickers of Interest
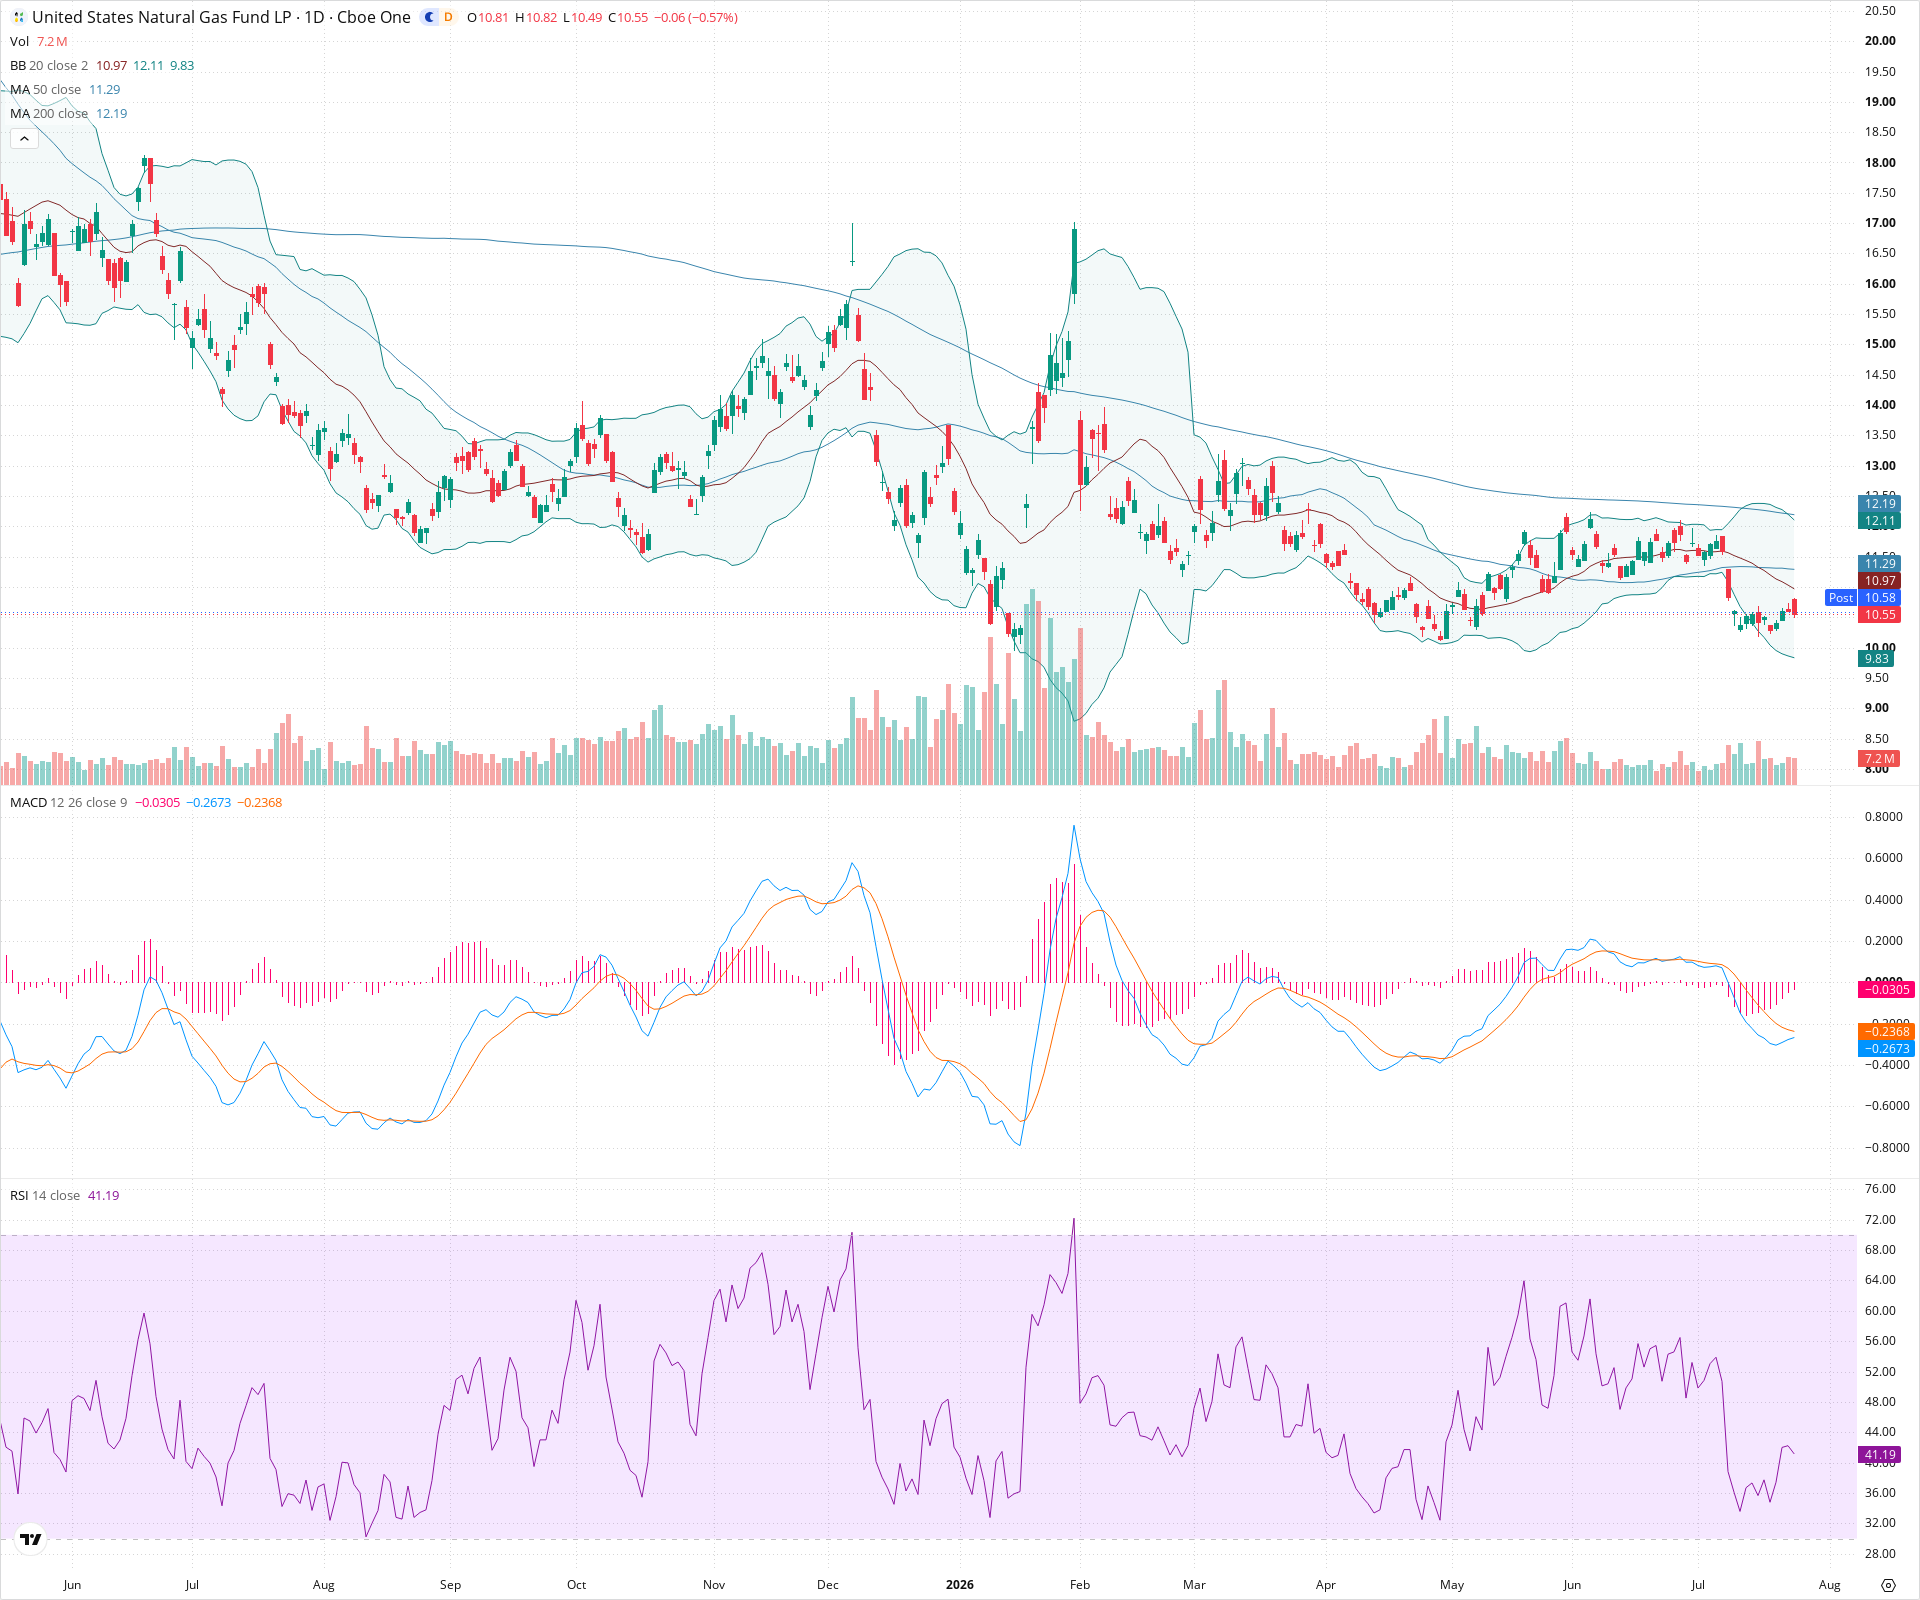
UNG Daily Chart
Sentiment
Short-term Sentiment (days to weeks): Bearish
Price is making new recent lows and is pushing against the lower Bollinger Band. Momentum indicators confirm weakness, with the MACD line crossing below the signal line and the negative histogram expanding, while RSI trends downward toward oversold levels.
Long-term Sentiment (weeks to months): Bearish
The asset remains in a firmly established long-term downtrend, trading significantly below both the declining 50-day and 200-day Simple Moving Averages. The 50-day SMA is also positioned below the 200-day SMA, confirming bearish macro structure.
Report Metadata
- Timeframe: daily
- Generated at: 2026-07-24T21:05:47.199Z
- Model: gemini-3.1-pro-preview
Support Price Levels
| Level | Range | Strength | Notes |
|---|---|---|---|
| $9.75 | $9.50 - $10.00 | Strong | Major previous swing low zone and psychological support level from earlier in the year. |
| $8.25 | $8.00 - $8.50 | Strong | Absolute structural bottom visible on the chart, characterized by massive historical volume spikes. |
Resistance Price Levels
| Level | Range | Strength | Notes |
|---|---|---|---|
| $11.13 | $10.97 - $11.29 | Moderate | Immediate resistance cluster encompassing the 20-day SMA and 50-day SMA. |
| $12.35 | $12.10 - $12.60 | Strong | Major resistance zone defined by the 200-day SMA and recent prominent swing highs. |
Potential Chart Patterns in Formation
| Strength | Pattern | Signal | Target | Details |
|---|---|---|---|---|
| Strong | Descending Channel | Bearish | N/A | Price action since the spring has formed a clear series of lower highs and lower lows, contained within a broad descending trend structure. |
| Moderate | Bear Flag Breakdown | Bearish | N/A | Recent sideways consolidation near $11.50 acted as a bear flag, which price has now broken down from, suggesting a continuation of the prior downward leg. |
Frequently Asked Questions about UNG
What is the current sentiment for UNG?
The short-term sentiment for UNG is currently Bearish because Price is making new recent lows and is pushing against the lower Bollinger Band. Momentum indicators confirm weakness, with the MACD line crossing below the signal line and the negative histogram expanding, while RSI trends downward toward oversold levels.. The long-term trend is classified as Bearish.
What are the key support levels for UNG?
StockDips.AI has identified key support levels for UNG at $9.75 and $8.25. These levels may represent potential accumulation zones where buying interest could emerge.
Is UNG in a significant dip or a Value Dip right now?
UNG has a Value Score of 42/100. It is not currently flagged as a significant dip in the Top Dips list. It is not listed as a Value Dip because the long-term sentiment or value-score threshold does not qualify.
View the full interactive analysis on StockDips.AI.